Species Composition and Food Habits of Dominant Fish Predators in Salt Marshes of an Urbanized Estuary, the Hackensack Meadowlands, New Jersey
by Melissa J. Neuman¹, Guillermo Ruess², and Kenneth W. Able²
¹National Oceanic and Atmospheric Administration, National Marine Fisheries Service, 501 W. Ocean Blvd., Suite 4200, Long Beach, CA 90802-4213
²Marine Field Station, Institute of Marine and Coastal Sciences, Rutgers University, c/o 132 Great Bay Blvd., Tuckerton, NJ 08087-2004
Abstract
The Hackensack Meadowlands, in heavily urbanized northern New Jersey, have undergone many types of human alteration within the past three centuries. In the last five years, attempts have been made to restore portions of the estuary to a salt marsh. To examine how fish fauna have responded to these efforts, we compared spatial and temporal patterns in the distribution and food habits of the dominant fishes collected in 457 gill-net samples during May to November 2001 from two tidal-marsh creeks in the Meadowlands. One of the creeks, Mill Creek, which has undergone two phases of mitigation since 1987, is dominated by both common reed (Phragmites australis) and salt-marsh cordgrass (Spartina alterniflora). The other, Doctor Creek, a man-made creek created in 1999–2000, is dominated solely by salt-marsh cordgrass. Water quality of the two creeks is similar in temperature but differs in salinity and dissolved oxygen: Mill Creek's salinity is 1.5 to 2 parts per thousand higher than that of Doctor Creek; it also has more frequent hypoxic conditions than Doctor Creek. We collected a total of 509 fishes representing ten species, and the dominant species (> 1% of the catch) were Morone americana (white perch, 46%); Pomatomus saltatrix (bluefish, 22%); Alosa pseudoharengus (alewife, 20%); Morone saxatilis (striped bass, 7%); and Brevoortia tyrannus (Atlantic menhaden, 3%). Overall fish species diversity and abundance were higher at Mill Creek than at Doctor Creek. The dominant piscivores (white perch, bluefish, striped bass) were found at almost all collection sites within each creek. The stomachs of most of these fish were 20% to 40% full, indicating that many of the fish collected had fed recently. Diet composition in both creeks was similar with respect to the consumption of fish; however, crustaceans made up a significant portion of the diet in Mill Creek fish, whereas detritus and microbenthos composed a large proportion of the diet of fish collected in Doctor Creek. Though both sites occur in a highly urbanized area, each appears to be providing fish habitat and food for typical marsh creek predators.
Key words: distribution and abundance; fish predators; food habits; Hackensack Meadowlands; Morone americana; Morone saxatilis; New York metropolitan area, Pomatomus saltatrix; salt-marsh creeks; urban estuary
Introduction
Estuarine habitats, especially salt marshes and associated creeks, play an important role in the life cycle of a wide variety of fish species (Able & Fahay, 1998). However, fish use of these habitats, and the factors influencing this use, are not fully understood, especially in the case of urbanized estuaries. Recent studies show that predators use natural tidal salt-marsh creeks for feeding and coordinate their foraging movements with the tide and other environmental conditions (Wollf, Clayton & Sandee, 1981; Wirjoatmodjo & Pitcher, 1984; Raffaelli, Richner, Sumers & Northcott, 1990; Rountree & Able, 1992; Szedlmayer & Able, 1993). A large number of tidal-marsh habitats have been altered by human activities, especially those in urban areas. The Hackensack Meadowlands in northern New Jersey are a prime example: They have been altered by construction, dredging, draining, mosquito control, industrial pollution, sewage and, more recently, recreational use (Kiviat & MacDonald, 2002). Yet the impacts of these alterations on estuarine-dependent fish predators have not been well studied.
In recent years, wetland restoration and mitigation efforts performed by the New Jersey Meadowlands Commission, the former Hackensack Meadowlands Development Commission, and Marsh Resources Inc. have attempted to restore the Meadowlands to more natural conditions (Kraus & Bragin, 1989; Louis Berger & Associates, Inc., 1999; Raichel, 2001). Phragmites australis (common reed) was removed, and site elevations were lowered in order to reestablish tidal inundation. Channels were dredged to further enhance water exchange. These alterations were expected to reduce the risk of anoxic and hypoxic events and improve conditions for fishes. To date, the potential impacts of the alterations have not been evaluated. In fact, few evaluations of fish-predator use in marshes of this estuary have been conducted. The few studies that have been carried out include a general inventory of fisheries resources within the Hackensack River (Kraus & Bragin, 1989) and a compilation of data by the U.S. Fish and Wildlife Service to justify the establishment of a national wildlife refuge in the Hackensack Meadowlands (Day, Staples, Russell, Nieminen & Milliken, 1999).
The objectives of our study were to 1) determine seasonal patterns of predatory fish use (distribution, abundance, species composition, size) in marsh creeks within the Hackensack Meadowlands that have undergone varying degrees of human alteration; and 2) examine the food habits of the dominant fish predators within the Meadowlands. We do not comment extensively on restoration success because there are no relatively undisturbed marshes in the watershed with which to make comparisons.
Material and Methods
Study Sites
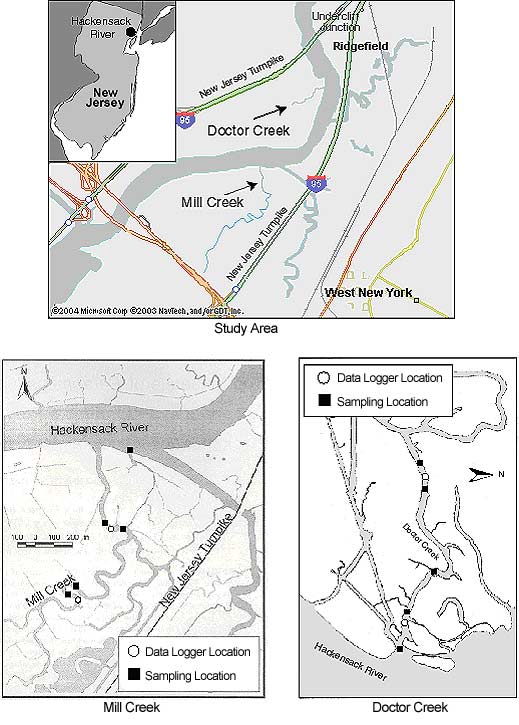
Two tidal-marsh creeks (Mill Creek and Doctor Creek) in the Hackensack River in northern New Jersey (Figure 1) were divided into three study sampling areas: 1) the mouth of each creek—Mill Creek Mouth (MCM) and Doctor Creek Mouth (DCM); 2) the lower portion of each creek—Mill Creek Lower (MCL) and Doctor Creek Lower (DCL); and 3) the upper portion of each creek—Mill Creek Upper (MCU) and Doctor Creek Upper (DCU). The distance to Newark Bay (approximately 16 km) and the ocean is similar for both creeks.
Mill Creek is about 2.2 kilometers* long and 20 meters wide. The depth is variable and generally ranges between 4 and 8 meters at high tide with some deep spots—the deepest point near the MCL site has a maximum depth of 25 meters. Average tidal range is 1.7 meters (derived using Nobeltec nautical software). The west bank of Mill Creek and the area at the MCU site are completely dominated by P. australis. The east bank and the remainder of the marsh stretching up to the eastern spur of the New Jersey Turnpike have undergone two phases of mitigation. The older phase of mitigation (approximately 24 hectares; 59.3 acres) was performed by the Hartz Mountain Development Corporation in 1987–88 and is enclosed by the Hackensack River to the west, MCL to the south, Cromakill Creek to the north, and the eastern spur of the New Jersey Turnpike to the east (Figure 1). This mitigation area is dominated by seeded Spartina alterniflora (salt-marsh cordgrass). The second phase of mitigation took place farther up the creek and was completed by the Meadowlands Commission in 1999. The area is bordered by Mill Creek to the west, the New Jersey Turnpike eastern spur, and Mill Creek Mall to the south (Figure 1). It consists of 56 hectares (approximately 138 acres) of man-made islands and lower and upper marsh areas. At the time of this study, in summer 2001, the marsh surface had no vegetation cover. The lower marsh is covered by water at high tide.
Doctor Creek is a man-made creek about 800 meters long and 20 meters wide. Its average depth is uniformly 2 meters at high tide, with an average tidal range of 1.7 meters. The profile across the creek is uniformly steep-sided with a flat bottom, except for a sill at the entrance to the creek in the Hackensack River. There are channels and smaller creeks linking the marshes with the Hackensack River. Doctor Creek is located within the area known as Transco Marsh and is the site of the Marsh Resources Inc. Meadowlands Mitigation Bank. The area around Doctor Creek is phase one of the Marsh Resources Inc. mitigation, and the whole marsh including Doctor Creek was created in 1999–2000. This phase of the mitigation consists of 82.5 hectares (approximately 204 acres) of man-made islands and high and low marshes. Before its creation, the marsh surface was dominated by P. australis. The Doctor Creek marsh surface is now dominated by S. alterniflora and S. patens (saltmeadow cordgrass), which have been planted or seeded (Louis Berger & Associates, Inc. 1999).
Sampling Design and Gear
Sampling in the Hackensack Meadowlands took place from May 22 to November 19, 2001 (Table 1). Sampling was conducted using monofilament gill nets (232 sets in Mill Creek and 225 sets in Doctor Creek). Each gill net measured 2.4 meters high by 6.1 meters long and was divided into four panels. Each of these panels had a different mesh size: 1.9 centimeters, 4.4 centimeters, 8.9 centimeters, and 10.2 centimeters, respectively. Peak sampling occurred in October (71 sets in Mill Creek and 63 sets in Doctor Creek). We performed all sampling during daylight at high tide, as Doctor Creek was only accessible by boat at high tide.
We deployed four nets in each creek, two at the lower sites (MCL and DCL) and two at the upper sites (MCU and DCU). In each creek, one net was deployed across the current, as much as the floating debris permitted. Another net was deployed across the mouth of one of the smaller side creeks. The remaining two gill nets were deployed parallel to the current in the center of the creek. When we sampled the mouths of the creeks (MCM and DCM), we deployed one net across the mouth of each creek. Because Mill Creek is a public waterway with some boat traffic, the sampling at MCM took place across the mouth of a side branch of the creek (see Figure 1). This side branch starts at the MCL site, where the remains of an old tide lock divides Mill Creek. Each net was deployed for one hour, and sampling was repeated once or twice the same day. Sampling alternated between Mill Creek and Doctor Creek, and over a typical two-week period, each creek was sampled on four days.
We identified all fish and measured their total length (TL) to the nearest millimeter. The sampling effort was measured as the number of fish captured per net per hour (CPUE, no. net-1 h-1). Spatial and temporal differences in CPUE and differences in mean lengths of the dominant predators were analyzed using analysis of variance (ANOVA) and Student-Newman-Keuls (SNK) multiple comparisons test (SAS Institute, 1990).
Stomach Contents Analysis
Selected predator species including Morone americana (white perch), M. saxatilis (striped bass), and Pomatomus saltatrix (bluefish), were measured and placed on ice until transfer to a land-based freezer. Subsequently, after partial defrosting, we recorded the wet weight of each whole fish. Its stomach was removed from the abdominal cavity, emptied into a finger bowl of 95% ethanol solution, and then returned to the abdominal cavity. We then reweighed the fish to determine a post–stomach extraction weight. We calculated a gravimetric index of stomach fullness by dividing the total prey weight (in grams) by the total predator weight and multiplying the proportion by 100 (Hyslop, 1980). Stomach contents were transferred to sample jars and preserved in 95% ethanol solution, with the staining agent rose bengal added to aid in identification. We looked for spatial and temporal differences in gravimetric indices for the dominant predators using ANOVA and SNK multiple comparisons test (SAS Institute, 1990).
In order to quantify stomach contents of individual predators, we determined the proportion by weight of each prey category according to the sieve fractionation method (Carr & Adams, 1972) as adapted by Nemerson and Able (2004): Stomach contents were poured through six sieves—2-millimeter, 850-micrometer, 600-micrometer, 250-micrometer, 125-micrometer, and 75-micrometer—which were mounted on a sieve shaker and rinsed with distilled water for approximately one minute. The contents were then sorted into finger bowls by sieve size. Occasionally, contents of separate sieves were combined. We identified prey constituents to the lowest possible taxonomic subdivision. Qualitative ratios based upon the weights of constituents belonging to the same taxonomic subdivision were recorded for each finger bowl. Their contents were then filtered onto dried, preweighed, and numbered filter papers using vacuum filtration. (Filter papers were dried and preweighed approximately 24 hours before use.) After filtration, the filter papers and contents were placed in an oven and dried for approximately 24 hours. We then weighed the filter papers and contents to within three significant figures of accuracy and determined gross weight.
Stomach contents (including plant matter) were divided into nine aggregated prey categories (Table 2). Consumption of prey belonging to each category is presented as gravimetric proportions (i) according to this formula:

Wij is the weight of prey summary category i in each sample j; ni is the total number of prey summary categories; and nj is the total number of samples examined.
Water Quality
We recorded temperature (in degrees Centigrade: °C), salinity (in parts per thousand: â), and dissolved oxygen concentration (in mg/L and %) using three types of stationary data loggers between June 13 and November 19, 2001. YSI 6000 data loggers were used at DCU and MCL, a YSI 600 data logger at MCU, and a Hydrolab DataSonde 3 data logger at DCL. In addition, a handheld YSI 600 unit was used October 9 to 16, 2001. Prior to the availability of data loggers, we collected surface-salinity samples with water bottles from May 22 to June 28 and later analyzed them in the laboratory using a YSI 600 data logger. In Doctor Creek, the data loggers were out of the water at low tide; therefore, no physical data are available for Doctor Creek at low tide.
Results
Physical Characteristics
Water quality was similar at Mill and Doctor creeks with respect to bottom-water temperature but different with respect to bottom salinity and dissolved oxygen (Table 3). Mean temperatures ranged from a low of approximately 12°C (53.6°F) in November to approximately 26°C (78.8°F) in August at both Mill and Doctor creeks. Mean salinity ranged from 3.1â in June to 11.5â in November at Mill Creek, and from 2.6â in June to 10.2â in November at Doctor Creek. The temporal trends (changes over time) in salinity at each site were similar, but values were 1.5 to 2.0â lower overall at Doctor Creek compared with Mill Creek. Mean dissolved oxygen ranged from a low of 2.0 mg/L in October to 3.5 mg/L in August at Mill Creek, and from 2.8 mg/L in June and October to 4.3 mg/L in July at Doctor Creek. Temporal trends in mean dissolved oxygen differed between sites: We recorded hypoxic conditions at Mill Creek in all months except July and August, but only during June and October at Doctor Creek.
Species Composition and Abundance
Over the sampling period, a total of 509 fish, representing ten species (Table 4), were collected using gill nets. The dominant species (> 1% of catch), ranked by their abundance, were white perch (46.17%); bluefish (21.81%); Alosa pseudoharengus (alewife) (19.84%); striped bass (6.68%); and Brevoortia tyrannus (Atlantic menhaden) (2.75%). All ten species were present in Mill Creek. In Doctor Creek, however, only six species—white perch, striped bass, bluefish, alewife, Cyprinus carpio (carp), Dorosoma cepedianum (gizzard shad)—were present.
Fish abundance also varied by season (Fig. 2a). Of the piscivorous predators, only white perch was collected during all months of the study. Striped bass was not collected in June and August, and bluefish was only collected from July to October. White perch (totaling 239 individuals) reached a peak in abundance in May and was at its lowest point in June. Abundance of white perch was significantly higher in May than in the months that followed (p < 0.01). Striped bass (34) peaked in abundance in October and declined to its lowest point in November. Bluefish (111) was present in collections beginning in July, peaked in abundance in September, and was absent from the collections by November. Bluefish abundance was significantly higher in September compared with all months except August (p < 0.05). Overall, abundance of striped bass was low compared with that of white perch or bluefish (Figure 2a).
We detected little spatial differentiation in abundance for the top three dominant piscivores, white perch, striped bass, and bluefish (Figure 2b). The only species that exhibited significant spatial differences in abundance was striped bass; catches at the mouths of both creeks were significantly higher than those in the lower and upper portions of each creek (p < 0.01). Abundance data for white perch and bluefish was variable, but these species tended to be least abundant at the upper creek sites (MCU and DCU) and most abundant at the MCL site. Bluefish never occurred in samples taken at the mouth of Doctor Creek. Overall abundance for all three species was higher in Mill Creek than in Doctor Creek.
Size Composition
Overall, the average sizes of piscivorous predators varied temporally for all three of the species examined and varied spatially for two of the three species examined. White perch ranged from 29 to 310 millimeters in total length (TL), but the collection was dominated by individuals ranging, on average, between 136 and 206 millimeters TL. Temporal trends in size for white perch revealed that the smallest individuals (< 60 mm TL) appeared in the collections in July, and most of the large individuals (> 250 mm TL) were collected in October and November at the MCU site (p < 0.01). Striped bass ranged from 145 to 570 millimeters TL, with most collections averaging between 194 and 381 millimeters TL. Most individuals of less than 300 millimeters TL were captured before October, and all individuals greater than 300 millimeters TL were captured in October and November, with the largest striped bass collected at the mouths and lower portions of the creeks (although these differences were not significant). Bluefish ranged in size from 60 to 230 millimeters TL, but the collection was dominated by individuals averaging between 147 and 186 millimeters TL. Bluefish were significantly smaller at the mouth of Mill Creek than they were at the DCU, MCL, and MCU sites (p < 0.01). Sizes increased progressively through the sampling season, with the smallest individuals (< 80 mm TL) appearing in August and the largest individuals (> 200 mm TL) last appearing in October.
Food Habits
Mean gravimetric indices of stomach fullness (total prey weight/predator weight 100 ± SE) ranged from 0.09 ± 0.041 for striped bass to 0.37 ± 0.118 for bluefish (Figure 3a). No significant differences in mean gravimetric indices of stomach fullness for the dominant predators existed between creeks. We detected no temporal differences in gravimetric indices of stomach fullness for white perch or striped bass; however, bluefish collected in July had significantly higher gut fullness indices compared with fish collected in the months that followed (p < 0.01; Figure 3b).
The degree of piscivory appeared to be similar between creeks for most of the dominant species. The percentage of stomachs that contained fish, that contained no fish but other prey items, or that were empty was similar between creeks for white perch and bluefish (Figures 4a, b). White perch stomachs contained very few fish (13% Mill Creek, 16% Doctor Creek), and a small percentage of the stomachs were empty (8% Mill and Doctor creeks). A large percentage of bluefish stomachs were empty (53% Mill Creek, 54% Doctor Creek), but when stomachs contained material, this material was predominantly fish (40% Mill Creek, 31% Doctor Creek). The percentage of fish material was higher in the stomachs of striped bass collected in Mill Creek compared with Doctor Creek (38% in Mill Creek versus 22% in Doctor Creek), while the percentage of empty striped bass stomachs was similar between creeks (Figures 4a, b).
There were species-specific differences in prey selection at the two creeks. In Mill Creek, white perch of all sizes (100–300 mm TL) consumed a large proportion of crustaceans (Figure 5a). In Doctor Creek, the stomachs of small white perch (< 160 mm TL) contained mostly microbenthos and detritus. White perch between 160 and 230 millimeters TL in Doctor Creek exhibited a more varied diet made up of fish, crustaceans, annelids, and mollusks (Figure 5b). Piscivory was evident in only large white perch (> 160 mm TL) from both creeks (Figures 5a, b). Piscivory was evident among all sizes (140–740 mm TL) of striped bass from both creeks (Figures 6a, b). Crustaceans made up a fairly large proportion of the stomach contents of smaller striped bass (< 370 mm TL) from Mill Creek. In addition to eating fish, small striped bass from Doctor Creek also consumed detritus, annelids, and microbenthos. Fish composed a large proportion of the stomach contents of bluefish greater than 140 millimeters TL from both Mill and Doctor creeks (Figures 7a, b). Bluefish less than 136 millimeters TL were only collected at Mill Creek, and they consumed detritus and unidentifiable material. We identified high proportions of crustaceans in the stomachs of bluefish from Mill Creek, but no crustaceans were identified in the stomachs of bluefish from Doctor Creek.
Discussion
Environmental Influence on Fish Abundance
With respect to water quality, dissolved oxygen (d.o.) may have had the most influence on the distribution of large predators. Dissolved oxygen readings were, in most cases, higher at Doctor Creek than at Mill Creek. The average values for both creeks were lower (Table 3) than values for oligohaline creeks in Delaware Bay (mean surface d.o. 7.2–7.9 mg/L [Able, Jones & Fox, 2004, submitted for publication]). Variation in available dissolved oxygen is normal for tidal-marsh creeks (Szedlmayer & Able, 1993; Rountree & Able, 1993) and has been implicated in directing the movements of mobile species within these systems (Bell, Eggleston & Wolcott, 2003). Fluctuations between hypoxic/anoxic and normoxic conditions have been found in other studies conducted in the Hackensack Meadowlands, but very often only average values over larger time scales (daily, monthly, annual) are reported (Kraus & Bragin, 1989; Raichel et al., 2003). With respect to fish use of marsh creeks, however, the frequency of individual events of low dissolved oxygen is probably more important than average dissolved oxygen values. Unfortunately, because dissolved oxygen values ranged widely over the course of a few hours in both creeks, it was difficult to capture the finer-scale changes in fish use of marsh creeks that may have resulted from fluctuations in dissolved oxygen levels given the relatively infrequent (less than weekly) sampling and our inability to determine individual movements of fishes over shorter time scales.
Data limitations aside, the general patterns of fish distribution suggested that the dominant predators occasionally were present in the creeks when hypoxic conditions existed. White perch appeared to tolerate the widest range of dissolved oxygen values. Relatively large numbers of white perch were collected in Mill Creek during hypoxic conditions. However, the presence of a deep hole (8 m) adjacent to one sampling site within Mill Creek may have provided a normoxic refuge. At other times when white perch were present with low dissolved oxygen conditions (< 2 mg/L), they were collected at the MCL site. It is possible that these fish were caught leaving Mill Creek on these occasions. Similarly, on the four occasions when we collected bluefish under hypoxic conditions, they were captured at the MCL site. Some of the highest bluefish catches occurred at these low dissolved oxygen levels (< 2 mg/L) when gill nets were set across the mouth of the Mill Creek. It is therefore possible that those fish were caught leaving Mill Creek. While large-scale changes in distribution and abundance patterns of mobile species have been related to hypoxia in other systems (Pihl, Baden & Diaz, 1991; Breitburg, 1992), only one study has demonstrated a fine-scale behavioral response of a mobile species to the dynamics of hypoxia (Bell et al., 2003). In our study, we rarely collected striped bass at values below about 3 milligrams per liter. This suggests that this species is less tolerant of low dissolved oxygen concentrations than white perch and bluefish, as observed in other marsh creeks (Tupper & Able, 2000).
It is likely that factors other than low dissolved oxygen contribute to differences in abundance of predators in Mill and Doctor creeks. Two possible major differences between them are food availability and water depth. Because Doctor Creek is much shallower than Mill Creek, low water levels might discourage predators from moving into Doctor Creek, especially at low tide.
Species Composition and Size
The dominant fish species (white perch, striped bass, and bluefish) observed in gill-net collections from the tidal-marsh creeks during May through November have also been found in the adjacent Hackensack River (Kraus & Bragin, 1989). These dominant species have also been observed in other low-salinity estuarine marsh systems in the northeastern United States during otter-trawl (Able et al., 2001) and gill-net collections (Tupper & Able, 2000; Able et al., 2004, submitted for publication). However, total species composition from the Hackensack River oligohaline marshes differ from polyhaline marshes. For example, in southern New Jersey marshes, the fauna is dominated by other fish species, including Mustelus canis (smooth dogfish), Paralichthys dentatus (summer flounder), Prionotus evolans (striped searobin), and Alosa mediocris (hickory shad) (Rountree & Able, 1997). A comparison with the fish fauna captured by gill nets in two naturally vegetated oligohaline marsh creeks in Delaware Bay (Able et al., 2004, submitted for publication) indicates an overlap in the composition of the dominant fish species. However, several less abundant freshwater species—Ameiurus catus (white catfish), Ictalurus punctatus (channel catfish), Perca flavescens (yellow perch)—and marine species— Caranx hippos (crevalle jack), Leiostomus xanthurus (spot), Micropogonias undulatus (Atlantic croaker), Pogonias cromis (black drum), Mugil curema (white mullet)—collected in Delaware Bay were absent from the Hackensack Meadowlands collections, suggesting reduced relative fish diversity in the Hackensack River study sites. Overall, species richness was greater in Delaware Bay marsh creeks (14 freshwater and 16 saltwater species) than in the Meadowlands marsh creeks (6 freshwater and 10 saltwater species).
Mill Creek and Doctor Creek varied in species composition, with greater species diversity present in Mill Creek. A possible explanation could be that Doctor Creek is much younger; it was created only one year prior to the start of this study. The flora and fauna may have still been developing at the time we sampled. White perch was the most abundant predator collected in this study and the only one present in all locations. This species was most common in spring and more so in Mill Creek than in Doctor Creek. Other studies confirm the year-round presence of white perch in the Hackensack Meadowlands (Kraus & Bragin, 1989). Striped bass was less abundant than the other predators, but total biomass may have been similar to other predators because individual striped bass grow much larger in size. We recorded significantly higher numbers of striped bass at the mouths of both creeks than at other locations. This pattern was evident in ultrasonically tagged individuals in Delaware Bay as well (Tupper & Able, 2000). Young-of-the-year bluefish were all of similar size when they first appeared in our collection samples. If they were resident in the summer months, as they are in other estuaries (Able, Rowe, Burlas & Byrne, 2003), it would be expected that they would increase in size over time. This they did, suggesting that the fish were foraging successfully in the creeks. Successful foraging by bluefish is also supported by the fact that they were collected in gill nets along with alewife, a species that made up a large component of bluefish diet.
Food Habits
Foraging behavior of white perch, striped bass, and bluefish between Mill and Doctor creeks, as gauged by gravimetric indices of stomach fullness, did not appear to differ between creeks. Temporal comparisons of gravimetric stomach fullness indices revealed that only bluefish exhibited a significant peak in foraging during July. While we expected that spatial and temporal differences in water quality might affect foraging rates, we found no evidence of this, despite the more frequent anoxic/hypoxic conditions in Mill Creek and lower frequency of anoxic/hypoxic conditions in July and August. There was no correlation between dissolved oxygen and gravimetric indices of stomach fullness for any species.
Species-specific patterns in diet composition between the creeks were similar in some ways but different in others. The amount of fish consumed by white perch and bluefish was similar in Mill and Doctor creeks, but more fish were consumed by striped bass in Mill Creek than in Doctor Creek. A more detailed look at the gravimetric proportions of contents in the stomachs of all species collected in both creeks revealed other differences. Fish consumption increased with increasing striped bass size in Mill Creek, as has been observed in this species in other systems (Nemerson & Able, 2003), but this pattern was not as clear in Doctor Creek. Crustaceans made up a large proportion of the diets of all species (especially striped bass and white perch) collected in Mill Creek, whereas detritus and microbenthos composed a large proportion of the material in the stomachs of fish collected in Doctor Creek. Compared with those of the other fish species, the gravimetric proportions of dietary constituents in bluefish stomachs were most similar between the sites. Other studies (Link & Almeida, 2000; Able et al., 2003) have shown that bluefish exhibit primarily piscivorous feeding over a broad size range, and this pattern was similar at the Hackensack River creeks.
The consequences of these differences in diet composition between the two creeks are uncertain. Additional studies designed to examine the movement and growth rates of fish from Mill and Doctor creeks would provide a better understanding of how diet composition, growth, and overall food-web dynamics of fish in the Hackensack Meadowlands are related. Regardless, even though both creeks occur in a heavily urbanized estuary, they provide structural habitats and feeding areas for some typical marsh-creek predators.
Acknowledgments
The authors would like to thank the following organizations and people for their funding and logistical support: the Meadowlands Environmental Research Institute (Rutgers University), Marsh Restoration Inc., the New Jersey Meadowlands Development Commission (formerly the Hackensack Meadowlands Development Commission), Rutgers University Marine Field Station, and the James J. Howard Marine Laboratory (Sandy Hook, New Jersey). Several individuals assisted in the field and laboratory and with statistical analyses, especially Jill Clougherty, Jason Demera, Vicky Friedel, Matthew Potenski, Justin Tralongo, Jessica Weiss, and David Witting. Thanks also to Ed Konsevick for the use of his laboratory. This is Rutgers University Institute of Marine and Coastal Sciences Contribution # 2004-10.