The Changing Flora of the New York Metropolitan Region
by Steven E. Clemants and Gerry Moore
Brooklyn Botanic Garden, 1000 Washington Avenue, Brooklyn, NY 11225
Abstract
We statistically analyzed 100 years of herbarium specimen data for woody plants in the New York metropolitan region in order to measure the floristic changes of this area. Change index values were computed for 224 of the region's 556 woody species to provide a specific measure of whether these species are expanding, contracting, or stable. The results show that, in general, nonnative invasive species are spreading rapidly in the region, while native species are in slight decline.
Key words: Chimaphila, ecological change; Ericaceae; herbarium; invasive plants; Lonicera; New York City, urban flora
Introduction
Plant species differ in their ability to adapt to environmental changes brought on by urban development and spread. Yet there are few studies that attempt to quantify the differences in adaptability among species (but see, for example, Dickson et al., 2000). In this study, we use current and historical data on woody plants in the New York metropolitan region to develop a change index measuring the relative degree to which species have expanded or contracted their ranges over the past century. The findings help us gain a better understanding of exactly how the flora of this urban region is changing and should prove useful to those attempting to improve and restore the ecosystems of the region.
It is difficult to quantify changes in the flora of the New York metropolitan region because the region, like other urban areas in the United States, has not been subjected to any long-term plant studies using standard sampling methods. In our study, we used herbarium specimen data from about a dozen herbaria in the northeastern United States. Botanists do not use a standard sampling method when collecting herbarium specimens: Some collect every plant they see, while others collect only the plants they are studying or those that are of particular interest at a site. But although there are a variety of sampling strategies, the strategies themselves have not changed significantly over the past century, and the data should be adequate for carrying out a comparison of the relative changes in the ranges of species.
Although our technique only analyzes the change in range of a species, it has been shown that there is a relationship between range and abundance of species (Hanski, Kouki & Halkka, 1993; He, Gaston & Wu, 2002). Therefore, an expanding range for a species is a good indication that the species may be increasing in abundance. Likewise, a range contraction is an indicator that a species may be declining in abundance.
Methods
This study is comparable to a study done for plants in Great Britain. We have predominantly used techniques developed by Telfer, Preston, and Rothery (2002), with a few modifications, spelled out in detail here.
The distributional data comes from the New York Metropolitan Flora (NYMF) project database (Moore, Steward, Clemants, Glenn & Ma, 2002; and see http://www.bbg.org/sci/nymf/). This database currently has nearly 250,000 records of plant occurrences from the New York metropolitan region. Each record is geo-coded to five-kilometer-square cells in a grid, with 964 cells total. We will call these cells "blocks." (The names used in this study are those adopted by the NYMF project; see Moore et al., 2002.)
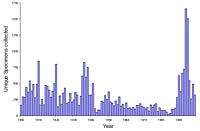
In this study, we used the woody-species data from the NYMF database. The woody-plant data set is the most complete one in the database and has over 145,000 records, representing 556 species. In our analysis, we only used records of woody species based upon herbarium specimens collected between 1901 and 2000. Once we narrowed the data to meet this criterion and eliminated duplicate records, there were 24,795 records remaining for this study. These records were made relatively evenly over the first half of the 20th century, but for the second half of the century, the bulk of the data is from the last decade (the 1990s), when the NYMF project began actively collecting (Figure 1).
The data were partitioned into two cohorts (time periods): the early cohort, containing data from 1901 to 1950, and the later cohort, containing data from 1951 to 2000. Following Telfer, Preston, and Rothery (2002), we only included blocks for which there were occurrences of a species in both cohorts. This reduced the number of blocks used in the analysis to 647. These 647 blocks are distributed throughout the New York metropolitan region (Figure 2). The Telfer, Preston, and Rothery study excluded species with fewer than five occurrences in the early cohort. In our study, we modified the procedure by excluding species with fewer than five occurrences in either the early or late cohort. This reduced the number of species in our study to 224.
The statistical methods for developing the change index are outlined in Telfer, Preston, and Rothery (2002). All statistics were calculated using Systat 10.2 statistical software (SPSS, 2000).
Results and Discussion
Table 1 lists the 224 species studied in this analysis, the raw sampling block counts for each cohort, species provenance (native or introduced), and the change index. Please note that the raw counts for some species show an increase over time, while their change indices show a decrease. This is because there are many more records in the later period (from the 1990s). The statistic essentially corrects for this overabundance of data. This means that a species showing no change in distribution will have a larger raw count in the later period than the earlier, and that some species may show a decrease in distribution while showing an increase in the raw count.
The first, unweighted least-squares regression equation was y = –1.05 + 0.66x, with r2 = 0.444. Following two iterations of the weighing procedure, we arrived at a weighted regression equation of y = –1.00 + 0.68x, with r2 = 0.467. We believe that the relatively low r2 is the result of two things. First, unlike in Telfer, Preston, and Rothery (2002), our data were not collected following a uniform procedure. Therefore, we suspect that there is greater statistical error in the data. Second, we believe we are studying a much more rapidly changing flora (an urban flora) than the one in the studies used by Telfer, Preston, and Rothery (a country-wide flora). Therefore, we would expect larger change indices in general.
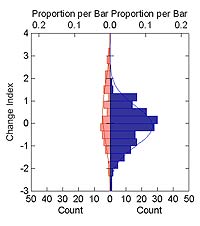
Figure 3 shows the distribution of change indices in relation to the provenance of the plant species. Because the data for natives are right-skewed, we used a Mann-Whitney U test to determine if the native and nonnative (introduced) species data are significantly different. The Mann-Whitney test statistic was 5054, which is significant (p = 0.014). This indicates that the nonnative species are increasing relative to the native species. In general, native species are showing slight decline, and introduced species are showing much greater expansion of their ranges, with only a few species showing any decline.
The change index in this study is valuable because it provides species-specific information about what is changing in the flora. For instance, nearly all the members of the heath family (Ericaceae) in the region are showing contraction of their ranges. There are probably many reasons why these species appear sensitive to urbanization, but three stand out: 1) most heath family species are acidophilic (Kron & Chase, 1993), and urban soils are generally more basic (Craul, 1992; Scheyer & Hipple, 2005); 2) many Ericaceae species are hydrophytes, and much wetland habitat has been lost over the past century (e.g., New Jersey lost an estimated 39% of its wetlands between 1870 and 1970, with half that loss occurring between 1950 and 1970; see New Jersey Sustainable State Institute, 2004); 3) the overabundance of white-tailed deer (Odocoileus virginianus) in suburban regions may impact some species through overgrazing (Department of Environmental Protection, Division of Fish, Game and Wildlife, 1999), though we expect this impact would be broad across many taxa.
The results show that several congeneric species have very different change indices. For example, Celastrus scandens, the native American bittersweet, has a change index of –1.15, while Celastrus orbiculata, the nonnative Oriental bittersweet, has a change index of +3.24. This wide disparity—indicative of a dramatic decline for the American bittersweet and a dramatic spread by the Oriental bittersweet—reinforces the results of a previously published account of these two species (Steward, Clemants & Moore, 2003).
Click images to enlarge

Figure 4. Range map of Lonicera sempervirens for the New York metropolitan area. (Native, Change Index = –1.93)

Figure 5. Range map of Lonicera japonica for the New York metropolitan area. (Introduced, Change Index = +1.60)

Figure 6. Range map of Lonicera dioica for the New York metropolitan area.

Figure 7. Range map of Lonicera morrowii for the New York metropolitan area.

Figure 8. Range map of Lonicera maackiii for the New York metropolitan area.

Figure 9. Range map of Chimaphila umbellata for the New York metropolitan area.

Figure 10. Range map of Chimaphila maculata for the New York metropolitan area.
Nonnative honeysuckles are significantly increasing, while native species are undergoing significant decline. The native Lonicera dioica and L. sempervirens have change indices of –2.87 and –1.93, respectively, and the nonnative L. japonica and L. morrowii have change indices of +1.60 and +1.73, respectively (see Figures 4–7). (In the case of L. japonica and L. sempervirens, the nonnative's growth architecture may be giving it a competitive advantage over its native congener and allowing it to increase its range; see Schweitzer & Larson, 1990; Larson, 2000). Another nonnative species, L. maackii, not included in this study because of its more recent date of introduction (and thus lack of any pre-1950 records), is also rapidly spreading in the region (Figure 8).
Other native-nonnative congeneric species groups also reflect this pattern, such as the following (change index in parentheses): nonnative Clematis terniflora (+1.33), native C. virginiana (–0.32); nonnative Morus alba (+2.41), native M. rubra (–1.71); nonnative Ribes rubrum (+0.28), native R. americanum (–0.41), native R. hirtellum (–1.92), and native R. rotundifolium (–0.54).
A striking pattern is observed for the New York metropolitan region's two native Chimaphila species (which are not being impacted by non-native congeners), with C. umbellata having a change index of –2.51 and C. maculata having a change index of –0.29 (Figures 9 and 10). While there have not been any studies aimed at better understanding why C. umbellata is declining at a greater rate than C. maculata, field botanists have hypothesized that C. umbellata may be more significantly affected by deer browsing than C. maculata, perhaps as a result of differences in leaf chemistry between the two species (Lamont & Young, 2004). Cowan (1945) reported that C. umbellata was casually eaten by deer.
Conclusion
Without question, the flora of the New York metropolitan region is rapidly changing. Most notably, nonnative invasive species are rapidly spreading in the area, while native species are generally in decline. Monitoring programs such as the NYMF project provide a mechanism by which these changes can be quantitatively measured. They may, in the future, be used to identify potentially invasive species before these species spread throughout the range. Also, these programs provide baseline data that future generations can use in comparative analysis to track floristic change.


