Benthic Communities in Spartina alterniflora– and Phragmites australis–Dominated Salt Marshes in the Hackensack Meadowlands, New Jersey
by Catherine E. Yuhas,¹ Jean Marie Hartman,² and Judith S. Weis³
¹ New Jersey Sea Grant College Extension Program, New York-New Jersey Harbor Estuary Program Office, 290 Broadway, 24th Floor, New York, NY 10007
² Rutgers University, 93 Lipman Drive, New Brunswick, NJ 08901
³ Department of Biological Sciences, Rutgers University, 411 Boyden Hall, Newark, NJ 07102
Abstract
Phragmites australis is invasive in Atlantic coastal salt marshes and often replaces the native cordgrass, Spartina alterniflora. Our research focused on benthic communities found in natural and mitigated P. australis and S. alterniflora salt marshes at two sites, Sawmill Creek (natural sites) and Mill Creek (mitigation sites) in the Hackensack Meadowlands, New Jersey. The area sampled at the natural sites consisted of adjacent stands of P. australis (P) and S. alterniflora (S) separated by a tidal creek. At Mill Creek, samples were collected at a 12-year-old mitigation site consisting of S. alterniflora (M-12) and a newly mitigated site (M-0) where site regrading had just taken place. Benthic samples were taken at the creek bank and the edge of vegetation for all sites. Data on salinity levels and textural and structural sediment characteristics were collected at each site. Our data indicate that both the P. australis and S. alterniflora sites support diverse benthic communities, although there were differences in diversity and composition in the communities found among the different types of grasses. The average abundance of benthic invertebrates at the Sawmill Creek natural sites ranged from about 35,000 per square meter (/m²) to over 240,000/m². Taxon richness was ∼10 at P and ∼7 at S and the P. australis site had more common taxa present (1.0% of the total abundance). Average abundance of benthic invertebrates at the Mill Creek mitigation sites ranged from about 130,000/m² to 3 million/m². Taxon richness was ∼10 at M-12 and ∼7 at M-0. This study suggests that significant change has not occurred at M-12 in the low marsh since the commencement of the mitigation in 1988.
Key words: Benthic invertebrates; estuarine ecology; Hackensack Meadowlands; low marsh; Phragmites australis; salt marsh; Spartina alterniflora; tidal estuary
Introduction
Spartina alterniflora (salt marsh cordgrass) dominates the low marsh zone of tidal marshes on the East Coast of the U.S. (Teal, 1962; Bertness, 1991). Spartina alterniflora provides habitat for salt marsh species, including a food source for benthic invertebrates and insects (Teal 1962; Van Dolah, 1978; Healy & Walters, 1994; Kneib, Newell, & Hermeno, 1997; Able & Hagan, 2000; Graca, Newell, & Kneib, 2000). Another salt marsh grass, Phragmites australis (common reed) is an invasive species usually found on high marshes, but it has been moving into low marshes and replacing S. alterniflora (Fell et al. 1998; Angradi, Hagan & Able, 2001; Windham & Lathrop, 1999; Weinstein & Balletto, 1999). Phragmites australis changes the marsh physically, hydrologically, and chemically (Angradi et al., 2001; Windham & Lathrop, 1999), and this can affect the utilization of the marsh by fish, birds, and other animals. Phragmites australis has been replacing native vegetation on the Atlantic and Gulf coasts since the early 1900s (Weinstein & Balletto, 1999; Fell at al., 1998; Angradi et al., 2001; Windham & Lathrop, 1999). Marsh managers have responded by trying to decrease the dominance of P. australis on salt marshes. Numerous restoration projects have been undertaken in which P. australis was removed and S. alterniflora replanted. However, there have been few direct comparisons of the relative level of function of marshes before and after restoration.
Recent studies on P. australis have found it to be an ecologically functional habitat for salt marsh inhabitants such as nekton (fishes and swimming decapod crustaceans) and benthic invertebrates (Rilling, Fell, & Warren, 1998; Meyer, Johnson, & Gill, 2001; Angradi et al., 2001; Fell et al., 1998). There have also been recent studies, using stable isotopes, which have found P. australis to be a food source for fish (Wainright, Weinstein, Able & Currin, 2000; Weinstein et al., 2000). However, other studies have found P. australis to be poor nursery habitat for the mummichog, Fundulus heteroclitus (Able and Hagan 2000; Raichel, Able, & Hartman, 2003).
Benthic invertebrates are vital to a functioning salt marsh ecosystem. They are a food source for many salt marsh inhabitants (Kneib, 1988; Fell et al., 1988; Sarda, Foreman & Valiela, 1995) and important components of the estuarine food web (Ishikawa, 1989). Benthic communities may be affected by the invasion of P. australis, though studies to determine the nature of the effects have been contradictory. Fell et al. (1998) conducted research along the Connecticut River and found that P. australis salt marshes were functionally equivalent to non-P. australis salt marshes. Four high-marsh macroinvertebrates (Orchestia grillus, Philoscia vittata, Melampus bidentatus, and Succinea species)—all of them prey species for F. heteroclitus—were the focus of this study, and they were found in both marsh types. However, Angradi et al. (2001) found that a Spartina marsh had greater production of benthic infauna than a Phragmites marsh. Overall abundance of benthic invertebrates was higher, and taxon richness was significantly higher in the Spartina marsh than the Phragmites marsh at all sampling positions and dates. Dominance by the three most abundant taxa (Oligochaeta, Nematoda, and Manayunkia aestuarina) was greater in the Phragmites marsh (>85%) than the Spartina marsh at most of the sampling positions, indicating a lower benthic diversity in the Phragmites marsh (Angradi et al., 2001). Posey, Alphin, Meyer, and Johnson (2003) found only minor differences between Spartina and Phragmites marshes in the Chesapeake Bay, although most species were slightly more abundant in Spartina.
Benthic invertebrates can be used to assess whether or not salt marsh restorations are functioning normally as ecosystems. In order to create a functioning ecosystem, a salt marsh restoration should include the reintroduction of vegetation and the duplication of the nekton and benthos, along with other environmental factors of the marsh (Packard & Stiverson, 1976; Allen et al., 1994; Sacco Seneca & Wentworth, 1994). Studies comparing natural and restored marshes have found similarities and differences with regard to fauna (Minello & Webb, 1997; Minton, 1999; Craft, Broome & Sacco, 1998; Havens, Varnell & Bradshaw, 1995; LaSalle, Landin & Sims, 1991; Sacco et al., 1994; Moy & Levin 1991). However, it's uncertain how many years it takes for benthic communities in restored or created marshes to become comparable to those in natural marshes. Created marshes are inhabited by opportunistic benthic species, which develop according to the sediment, hydrodynamics, and vegetation of the marsh (Posey, Alphin & Powell, 1997). The more recently created marshes studied by Posey et al. (1997) had more polychaetes than the older created marshes, which had more oligochaetes and amphipods. Packard and Stiverson (1976) suggest that a Spartina marsh restored on dredge spoils will eventually sustain a detritus-based community, which is a major food source for benthic invertebrates.
In a few studies, restored salt marshes have been deemed to have characteristics similar to natural marshes (Posey et al., 1997). Some studies indicate that the benthic communities in natural and restored marshes are similar. For example, LaSalle et al (1991) found that benthic communities, along with fish and shellfish, of a natural marsh that developed on dredged material were similar in species composition and abundance to those of natural marshes.
Our study has two objectives. The first is a comparison of the benthic communities of a natural Spartina marsh and a Phragmites marsh. The second is a comparison of two restored marshes of different ages (> 10 years, < 1 year).
Methods
Study Sites
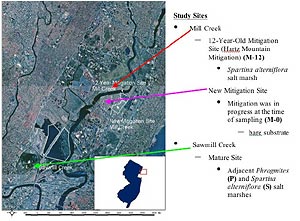
The Hackensack Meadowlands District covers 32 square miles in Bergen and Hudson counties of New Jersey (Figure 1). It is uncertain when P. australis first appeared here, but published sightings of the plant in New Jersey date back to the 1800s (Willis, 1877; Britton, 1889; Harshberger & Burns, 1919). In our study, we conducted a comparison of natural marshes dominated by S. alterniflora and P. australis at Sawmill Creek (natural sites, Figure 1) and an assessment of mitigated intertidal marshes at Mill Creek (mitigation sites, Figure 1).
Sawmill Creek Natural Sites
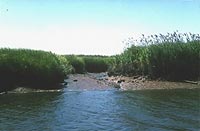
The study sites located at Sawmill Creek run along the southern section of the Hackensack River in Lyndhurst, New Jersey. This area is a natural salt marsh that was formed in 1950 after a tide-gate breach (Kraus & Kraus, 1988). The known salinity range at this site is 6.9 to 15.7 parts per thousand (ppt)—mesohaline—and the tidal range is approximately 1.5 meters. Phragmites australis is the dominant vegetation at the natural sites, but extensive marshes of S. alterniflora can be found as well. We sampled from microhabitats located in adjacent stands of P. australis (P) and S. alterniflora (S) separated by a tidal creek (Figure 2).
Mill Creek Mitigation Sites
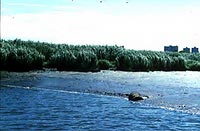
The mitigated marshes were located at Mill Creek, in Secaucus, New Jersey (Figure 1), an area dominated by P. australis. One of the marshes was mitigated in 1988, 12 years before this study, while the other was undergoing mitigation at the time of the sampling. The 12-year-old site (M-12, Figure 3), located along the northern part of the Hackensack River (Hackensack Meadowlands Development Commission, HMDC, 2000), covers 63 acres and was mitigated by Hartz Mountain Company. Mitigation consisted of removing P. australis, decreasing site elevation to enhance daily tidal inundation, planting S. alterniflora, and site monitoring (TAMS, 1990). This site is completely surrounded by industry, highways, and numerous forms of urbanization (TAMS, 1990; HMDC, 2000). The tidal range at M-12 is approximately 1.5 meters, and the salinity range is 0.5 to 7.0 ppt—oligohaline (Kraus & Kraus, 1988).
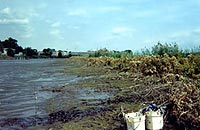
The newly mitigated site (M-0, Figure 4), located behind the Mill Creek Mall, in Secaucus, covers an area of 140 acres and was overseen by the New Jersey Meadowlands Commission (formerly the Hackensack Meadowlands Commission). Mitigation began here in 1998 and was conducted to eliminate P. australis, increase tidal inundation, and create a low marsh system (HMDC, 2000). At the time of sampling at the M-0 site, the mitigation was still under way, and all that remained was bare substrate, some P. australis, and Pluchea purpurascens, an annual salt marsh fleabane that flowers between late summer and fall (Newcomb, 1977).
Organic Matter and Particle Size
We took sediment samples to a depth of 5 centimeters (cm) in September 1999 using a PVC corer. Three replicates were made at each of the four sampling stations. Samples were kept in a cold room prior to processing. The samples were initially sieved wet through a 4.75-millimeter (mm) sieve to collect any pebbles, stones, and large pieces of organic material. We determined the following sediment characteristics: percentage organic matter and percentage silt, sand, and clay.
To determine organic content, five grams of wet sediment were placed in a ceramic crucible, weighed, and placed in a 105°C oven for 16 hours. Samples were then reweighed to determine the dry weight, placed in a hood, and put in a 440°C muffle furnace for 16 hours. Samples were then cooled in the hood and reweighed in order to determine ash dry weight. The percentage of organic matter was calculated using the following equation: (Dry Weight – Ash Weight)/Dry Weight × 100.
To determine particle size, the remaining sediment samples were air dried in a university greenhouse. Pieces greater than 3.175 mm in diameter were removed from the sediment after it was crushed with a mortar and pestle. The sediment was analyzed using the LaMotte Soil Texture Unit (code 1067, LaMotte Co., Chestertown, MD), which provides a volumetric calibration of sand, silt, and clay through sedimentation in an aqueous solution.
Benthic Sampling
We collected benthic samples in the natural (S and P) and mitigation (M-0 and M-12) sites at two low-marsh microhabitats: (1) the creek bank and (2) the edge of each type of vegetation on the marsh surface. At the natural sites, the creek bank sampled was a steep area coming off the vegetated marsh surface into an emergent area in the intertidal zone. At the mitigation sites, the creek bank sampled was a gently sloping emergent area in the intertidal zone coming off the vegetated (M-12) or nonvegetated (M-0) marsh surface. At M-0, the "edge of vegetation" was estimated by examining vegetation surrounding the site.
Benthic samples were taken at all sites with a 3.9-cm-diameter PVC core sampler. The cores were taken to a depth of 5 cm at each sampling station. Cores were taken at this relatively shallow depth because it has been shown that in stressed marshes (for example, those that are contaminated or have low dissolved oxygen), the large, deep-burrowing invertebrates disappear, and the community becomes dominated by small animals that live close to the sediment surface (Warwick, 1993). Weis, Skurnick, and Weis (2004) have found an absence of larger, deeper-dwelling fauna in the Meadowlands.
We collected three replicates at all sampling sites. Creek-bank samples were collected once a month at low tide from June to September 1999. Edge-of- vegetation samples were collected from July to September 1999. Surface-water salinity at each site was measured with a refractometer.
Click image to enlarge
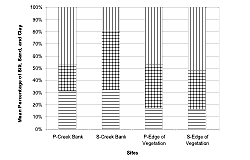
Figure 5: Mean percentage of silt (horizontal lines), sand (dotted pattern), and clay (vertical lines) at the creek bank and edge of the vegetation habitats of the Sawmill Creek natural sites. Samples were taken at Sawmill Creek—Spartina alterniflora (S) and Sawmill Creek—Phragmites australis (P) during September 1999.
Biota
Unsieved benthic samples (mud and organisms) were preserved in 20% formalin in the field. After one to two weeks, samples were transferred to 70% ethanol with rose bengal dye for staining of the benthic invertebrates. The samples were sieved in a 0.3-mm sieve, sorted, and identified in a petri dish to the lowest possible taxonomic level to determine taxa richness, overall abundance, and species composition (Weiss, 1995). The numbers of nematodes were estimated for a site when an average of ≥ 100 nematodes were found in each sample. The petri dishes utilized were counted and multiplied by the mean number of nematodes in the first two petri dishes sorted for that particular site. For this study, composition comparisons focused on those taxa that were classified common (≥ 1.0% of the total abundance) and uncommon (> 0.1% but < 1.0%) (LaSalle & Rozas, 1991).
Statistical Analysis
We analyzed all the benthic samples using the Statistical Analysis System (SAS) software (Version 8). Multiple analysis of variance (MANOVA) and the Student-Newman-Keuls (SNK) tests were used to analyze the monthly benthic samples (p < 0.05). The percentage of organic matter and the percentage of silt, sand, and clay were analyzed by running analysis of variance (ANOVA). All data were tested for normality, and any abundance data with abnormal distribution were log-base-10 transformed. A commonly used measure of diversity, the Shannon-Wiener Index, was calculated using Multivariate Statistical Package (MVSP) software (Version 3.12c).
Results
Sawmill Creek Natural Sites
Organic Matter, Particle-Size Distribution, and Salinity
We found a significant difference between the percentage of organic matter in the creek-bank sediment samples from S (3.08%) and P (1.58%) (Table 1 and Table 2, p = 0.0003/df = 2). There was no significant difference in percentage of organic matter at the edge of the vegetation among the natural sites (Table 1 and Table 2, S: 2.18%; P: 2.28%). However, the mean percentage of organic matter was significantly different between the creek bank and the edge of the vegetation for both P. australis (p = 0.0656/df = 1) and S. alterniflora (p = 0.0251/df = 1).
We found no significant differences in percentage of silt in the creek-bank samples at the natural sites. The sediment was significantly coarser at S than P on the creek bank since S had more sand present (Table 1 and Table 2, P = 0.0038/df = 2). There were fewer fine particles (less clay content) at S than P (Figure 5, Table 2, p = 0.0128/df = 1). We found no significant difference between sites in particle-size distribution at the edge of the vegetation.
At both natural sites, the salinity was 8 ppt in June, 15 ppt in July, 20 ppt in August, and 4 ppt in September. The increase in salinity from June to August was due to a drought during the summer of 1999. The drastic salinity decrease in September was due to rainfall associated with Hurricane Floyd on September 16, 1999.
Abundance, Richness, and Composition
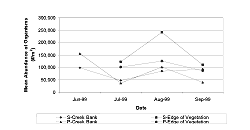
We found no significant differences in the total number of organisms over all months sampled on the creek bank for the natural sites (Figure 6, Table 3 and Table 4, p > 0.05/df = 1). Mean abundance at the edge of the vegetation was not significantly different for July and August (Figure 6, Table 4), but during September, P had significantly less abundance than S (p = 0.0212/df = 1). The natural sites showed no significant difference for July, August, and September between creek-bank and vegetation-edge habitat types for S or for P.
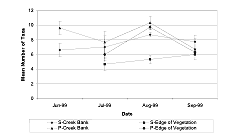
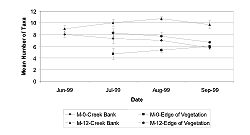
There was no significant difference in taxa between S and P at the creek bank for all months sampled. The mean taxa richness at the edge of the vegetation did show significant differences for some months (Figure 7, Table 3 and Table 4, p < 0.05/df = 1). During August, P had a significantly higher number of taxa than S at the edge of the vegetation (Table 4, p = 0.0255/df = 1). However, there was no significant difference between S and P at the creek bank for July and September. In August, the creek bank of S had significantly higher mean taxa richness (p = 0.0241/df = 1) compared to P.
Presence (+) and absence (–) of the 25 taxa found over the four months at the sites is documented in Table 5. Three types of meiofauna (Nematoda, Copedoda, and Ostracoda) and several macrofaunal taxa dominated the collections. We identified ten common taxa and eight uncommon taxa at P (Table 6). Eight common taxa were found at S, along with six uncommon taxa (Table 6). Oligochaeta (24.4%) had the highest percent composition at P, while Manayunkia aestuarina (33.0%) had the highest percent composition at S.
Shannon-Wiener Diversity Index
We found a significant difference between taxa diversity on the creek banks of the different sites for June. In this month, P was significantly more diverse than S (p = 0.0347/df = 1), but during July, August, and September, there was no significant difference (p > 0.05/df = 1) between P and S (Table 3 and Table 4). At the edge of the vegetation, P had significantly more diversity than S in August (p = 0.0371/df = 1), but not in July and September (p > 0.05/df = 1).
The taxa diversity between the two habitats at S was significantly different in July (p = 0.0218/df = 1) and August (p = 0.0189/df = 1), when the creek bank was more diverse than the edge of the vegetation (Table 4). For September, there was no significant difference between the two habitats at S. At P, there was no significant difference in July and September (p > 0.05/df = 1), but in August the creek bank was significantly more diverse than the edge of the vegetation (p = 0.0081/df = 1).
Mill Creek Mitigation Sites
Organic Matter, Particle Size Distribution and Salinity
Organic matter at the creek bank for M-0 was calculated to be 1.69% compared to 1.33% at M-12 (Table 1 and Table 2, p = 0.0027/df = 2). There was no significant difference at the edge of the vegetation among the sites (M-12: 2.02%; M-0: 2.31%). For both sites, the mean percentage of organic matter was significantly higher at the edge of the vegetation habitat than the creek bank (M-12: p = 0.0088/df = 1; M-0: p = 0.0075/df = 1).
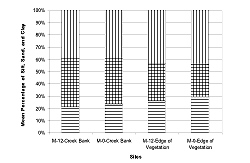
We found no differences in silt, sand, and clay percentages (Table 1 and Table 2; Figure 8) between the creek banks of both mitigation sites. In addition, no difference was discernable at the edge of the vegetation between the sites.
Salinity at the mitigation sites (M-12) was 3 ppt in June, 10 ppt in July, 10 ppt in August, and 2 ppt in September. The mitigation sites at Mill Creek, following a pattern similar to the natural sites at Sawmill Creek, decreased in salinity in September in concurrence with the rainfall of Hurricane Floyd.
Abundance, Richness, and Composition
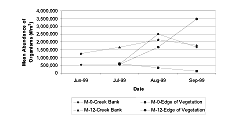
We found no significant difference in the total number of organisms on the creek bank of the mitigation sites for all months sampled (Table 3 and Table 4, Figure 9). The mean abundance at the edge of the vegetation was not significantly different between the sites for July (Figure 9, Table 4, p = 0.8001/df = 1). However, during August (p = 0.0133/df = 1) and September (p < 0.0001/df = 1), abundance at M-12 was significantly greater than at M-0. Abundance was greater at the marsh edge than the creek-bank habitats for July at M-12 (p = 0.035/df = 1); and it was greater at the creek bank than the marsh edge for August (p = 0.0024/df = 1) and September (P < 0.0001/df = 1) at M-0 (Figure 9, Table 4).
In August and September, the taxa richness on the creek bank at M-0 was lower than at M-12 (Table 3 and Table 4, Figure 10, August: p = 0.0004/df = 1; September: p = 0.0058/df = 1). During July, M-12 had more taxa present than M-0 at the edge of the vegetation (Table 3 and Table 4, Figure 10, p = 0.0048/df = 1). The mean taxa richness for M-12 was significantly higher at the creek bank in August (p = 0.0158/df = 1) and September (p = 0.0335/df = 1) than at the edge of the vegetation.
Refer to Table 5 for presence (+) and absence (–) of the 25 taxa found over four months at all of the sites. At M-12, four common taxa were found along with two uncommon taxa (Table 6). Four common taxa and three uncommon taxa were found at M-0 (Table 6). Nematoda were the most abundant taxa at both M-12 and M-0. The mitigation sites were heavily dominated by nematodes, which comprised approximately 77%–80% of all taxa.
Shannon-Wiener Diversity Index
In August, we found that M-12 was more diverse than M-0 at the creek bank (Table 3 and Table 4, p = 0.0464/df = 1). During June, July, and September, there was no significant difference between M-12 and M-0. At the edge of the vegetation, M-12 had less diversity than M-0 in August (p = 0.0225/df = 1) and September (p = 0.0014/df = 1), but during July, M-12 was significantly more diverse than M-0 (p = 0.0333/df = 1).
At M-12, benthic taxa diversity was not significantly different between the creek bank and the edge of the vegetation for July, August, or September. The taxa diversity between the two habitats at M-0 was significantly different in August (p = 0.0012/df = 1) and September (p = 0.0007/df = 1), when the edge of the vegetation was more diverse than the creek bank. For July, there was no significant difference between the two habitats at M-0.
Discussion
Sawmill Creek Natural Sites
Angradi et al. (2001) compared the benthic communities in P. australis and Spartina marshes and found that the Spartina marsh had a greater abundance and taxa richness than P. australis marsh. However, we found no clear pattern of difference in taxa abundance and richness at P. australis and S. alterniflora marshes during our study period. As in Angradi et al.'s study, oligochaetes, nematodes, and Manayunkia aestuarina were the dominant taxa in our study. And both studies included samples from the creek bank and the edge of the vegetated marsh. However, Angradi et al. sampled from within the vegetated zone of the marsh, whereas we did not. Since our samples were collected from the creek bank and the marsh edge only, the data may not be reflective of the marsh surface.
There have been studies that have looked at marsh surface and made comparisons between P. australis and S. alterniflora marshes, including Posey et al. (2003) and Fell et al. (1998). Posey et al. found that the macrobenthic communities in paired P. australis and S. alterniflora marshes of Chesapeake Bay—an oligohaline to mesohaline environment—were affected by the vegetation type. While they noted few significant differences in the abundance of most individual taxa, they did find a significant overall community trend toward a higher rank abundance of the invertebrates in the S. alterniflora marsh compared to the P. australis marsh. Fell et al. looked at epibenthic communities in non-P. australis and P. australis marshes and found them to be equivalent.
Mill Creek Mitigation Sites
TAMS (1990) evaluated the benthic community in the open-water channels at M-12 and found it to have low diversity. Ten years after this study, our investigations showed that the low diversity still persists. TAMS also found that the benthic community at M-12 consisted of pollution-tolerant organisms, with oligochaetes and hydrobiid gastropods comprising more than 80% percent of the community. In our study, nematodes made up about 80% of the benthic community, and there were only four common taxa found at this site. We conclude that this site is still dominated by few taxa with large abundances.
Our results are similar to those of Kraus and Kraus (1988), who studied mitigation and natural sites in Sawmill Creek and sampled the mitigated (S. alterniflora) and nonmitigated (P. australis) sections of Mill Creek. Like us, they found that Sawmill Creek had a greater abundance, higher taxa richness, and higher diversity of benthic invertebrates than the Mill Creek sites, which were dominated by gastropods and nematodes. However, there are two serious obstacles to comparing the studies. First, Kraus and Kraus did not specify the precise locations sampled at Sawmill Creek. Nor did they specify exactly where the Mill Creek control sites were located or which type of vegetation was present there. Second, previous studies have shown that low salinity decreases abundance, taxa richness, and diversity of benthic communities (Levin & Talley, 2000; Boesch, 1972; West & Ambrose, 1992). Insects and oligochaetes usually dominate benthic communities in a low-salinity system, while a high-salinity system is known to favor polychaetes (Levin & Talley). There is evidence for this in our study, which shows that the high-salinity natural sites had considerably more polychaetes than the low-salinity mitigation sites, and that both site types had an abundance of oligochaetes. Oligochaetes were one of the few common taxa found at Mill Creek, while at Sawmill Creek they were one of the many common taxa.
Studies have shown that contaminants and pollutants affect benthic communities (Gray, Clarke, Warwick & Hobbs, 1990; Pocklington & Wells, 1992; Gaston & Young, 1992; Whaley, Garcia & Sy, 1989; Maltby, 1999; Flynn, Wakabara & Tararam, 1998). According to Levin and Talley (2000), a marsh exposed to sewage has a greater abundance of the oligochaete Monopylephorus rubroniveus and the amphipod Talorchestia longicornis. The mitigation sites at Mill Creek had abundant oligochaetes. A contamination source that may be affecting the benthic community at the mitigation sites is the sewage-treatment plant along Mill Creek. Kraus and Kraus (1988) reported that the water quality was better at the natural sites than at the mitigation sites. However, during the dates of our study, water quality was better at the mitigation sites than at the natural sites (Center for Information Management, Integration and Connectivity, CIMIC, 1999). But water quality on a single date is far less important than long-term sediment concentration, which would impact benthos. Contamination persists in the mitigation sites' sediments, but an experiment replacing contaminated sediments with uncontaminated ones showed no shift in community composition (Yuhas, 2001).
Overall, this study suggests that significant change has not occurred at the M-12 site at the low marsh since the commencement of the mitigation in 1988. Development of a diverse benthic community may not have occurred because of the low salinity that is representative of an oligohaline area. Changing the vegetation from P. australis to S. alterniflora may not, alone, be able to alter the environmental conditions (Packard & Stiverson, 1976; Allen et al., 1994; Sacco et al., 1994) at Mill Creek that affect the benthic community.
This study was a small pilot effort. It is consistent in several ways with some previous studies of the Hackensack marsh system. However, it also shows that a more in-depth examination of the complex interactions between salinity, vegetation, time, and contamination is needed to understand the structure and dynamics of the benthic community in the system.
Acknowledgments
We would like to acknowledge Ed Konsevick and Brett Bragin for facilitating fieldwork, and Lisa Windham for all her help in the field. We would also like to express our gratitude to all the members of the Hartman Lab Group for their assistance and advice. Inga Parker's assistance with editing transformed the manuscript and is much appreciated. We would like to thank the editors and the reviewers for their comments that improved the manuscript. This research was funded by a grant from the New Jersey Meadowlands Commission under the direction of Dr. Jean Marie Hartman and the New Jersey Agriculture Experiment Station.

