City size, regional landscape context, and local resource characteristics influence patterns of bee occurrence: A case study from northwestern Costa Rica
by Victoria A. Wojcik
Pollinator Partnership, 423 Washington Street, 5th floor, San Francisco, CA 94111
University of California, Berkeley Department of Environmental Science, Policy, & Management, 132 Mulford Hall, Berkeley, CA 94620
E: [email protected]; [email protected]
T: 510-697-3890/415-362-1137
F: 415-362-3070
Abstract
Understanding the ecological patterns of bees in cities can aid in their conservation and management. This is especially important in regions experiencing rapid anthropogenic change that threatens the survival of these important pollinators and the ecological services that they provide. To study occurrence trends at the community level, bees visiting a common and abundant floral resource species, Tecoma stans, were sampled across three urban landscapes located in the tropical dry forest of northwestern Costa Rica. Frequency-of-visitation counts that measured both bee visitor abundance and bee taxon richness were used to assess foraging variation and individual resource constancy, and to evaluate the effects of plant resource characteristics (floral abundance, resource size, and vertical structure), city size, and regional landscape context on bee occurrence. Of the resource characteristics studied, only the total number of flowers at a food resource had a significant impact on bee occurrence, with resources that possessed more flowers attracting more bees and more bee types. The taxon richness observed at a resource increased significantly as city size increased, but there was no association between city size and bee visitor abundance. Cities located within similar regional landscapes had similar bee community composition, indicating that the surrounding landscape influenced species presence and absence patterns. The patterns of occurrence recorded in this study can be seen as a positive result for bee conservation and management in urban landscapes; the correlation of high bee visitation with abundant flowers suggests that efforts to increase resource availability should be successful in producing a corresponding increase in bee presence.
Keywords: bees, hymenoptera, pollinators, foraging, resource characteristics, regional landscape, tropical dry forest, Costa Rica, Tecoma stans
Introduction:
Bees are essential ecosystem service providers that are in large part responsible for maintaining terrestrial diversity and productivity. The association of bees with flowering plants structures and sustains ecosystems (Kevan 1999; Kevan 2001; Costanza et al. 1997) from which humans and other species derive direct and indirect benefits (Buchmann and Nabhan 1996; Daily 1997; Kevan and Wojcik 2007). Declines in populations of bees have been noted in recent years and are driven in part by land-use intensification, such as the conversion of wildlands into agricultural and urban landscapes (NRC 2007; Kremen et al. 2007; Winfree et al. 2007; Winfree et al. 2009). Land-use intensification often diminishes or removes the nesting and foraging habitats of native bees (Kremen et al. 2002). The tropical dry forest region of Costa Rica is an example of an area of rapid urbanization where declines in bee numbers have been noted at the interface of urban development (Frankie et al. 2009). Declines in the abundance and diversity of bees are paralleled by declines in pollination services (Kevan and Phillips 2001). Continued declines in pollination could have serious ecological and economic impacts, as one third of the food we eat is dependent on pollinators (Buchmann and Nabhan 1996), and the majority of flowering plants require pollinators for reproduction (Kevan 1999).
Early twentieth-century taxonomic surveys verify that bees have been present in urban landscapes for some time (Robertson 1929; Graenicher 1930). More recently, rich communities of bees have been documented in cities in North America (Frankie et al. 2005b; Tommasi et al. 2004; Fetridge et at. 2008; Matteson et al. 2008), Central America (Frankie et al. 2009a), South America (Matteson et al. 2008; Loyola and Martins 2006; Nates-Parra 2006), Europe (Banaszak 1982; Berezin 1995; Saure 1996), and Asia (Sakagami and Fukuda 1973; Hisamatsu and Yamane 2006). Although the presence of bee communities within cities does not suggest that urban landscapes can entirely compensate for lost habitat, the colonization of urban green space by bees might provide a buffer for some of the effects of wildland degradation on pollination services. This observation has led scientists to investigate the conservation and management potential that human landscapes hold for ecologically and economically important species.
Understanding why a species occurs at a site and what factors are important to this occurrence can inform conservation planning and management. Associations between bees and flowering plants are thought to be distinct and predictable—seasonality, host-specificity, and daily flight times are patterned (Linsley 1958; Ginsberg 1983; Wojcik et al. 2008). Resource usage and exploitation are often optimized with the heavy metabolic demands of flight (Heinrich 1979). In tropical systems, floral resources occur at many strata with corresponding vertical stratification, or structural niche partitioning, in different bee species (Roubik 1993). Bees also display site-specific preference patterns in their foraging behaviors, and not all resources within a landscape are visited equally. The study of bee ecology in urban landscapes has focused mostly on identifying species presence and absence, describing faunas, or outlining host plant interactions. More detailed studies that outline local occurrence patterns are needed to develop a better understanding of bee foraging strategies and behaviors in cities.
Click image to enlarge
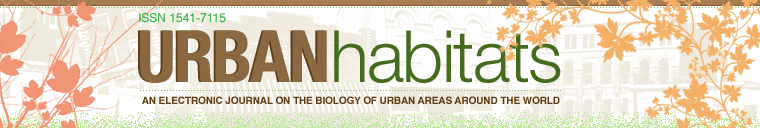
Figure 1: Examples of Tecoma stans plants growing in tropical urban landscapes and displaying a range of structural morphology. Clockwise from top left: (a) shrub, (b) hedge, (c) tree, and (d) a close-up of the inflorescence.
Tecoma stans Kunth (Bignoniaceae) is a common, mass-flowering, woody perennial found across Costa Rica and much of the tropics. In urban environments, it is prominent in home gardens and city squares and along city streets. It has been used extensively as a decorative ornamental because of its year-round production of striking, yellow, trumpet-shaped flowers. Previous observations indicated that T. stans attracts a wide range of bee species from many genera, diverse guilds, and many foraging strata, representing over 10% of the local wildland bee fauna (Wojcik 2009). In the three urban landscapes under study here, T. stans is ubiquitous and presents substantial variability in plant form and structure, particularly in urban landscapes where human management, such as pruning, has resulted in individuals that range from low-growing shrubs through full hedges to tall trees (Figure 1). Its ubiquitous distribution, structural variability, and observed high attractiveness to bees make T. stans a good case-study species for investigations of urban bee foraging preferences in multiple tropical cities.
The goal of this study was to determine what makes a food resource located within a city attractive to local bee species. Are the structural and morphological patterns documented in wildland systems conserved in urban systems? Are all cities similar, and do bees choose the same types of resources in any urban landscape? Furthermore, given the diversity of bee species within urban systems, are all of these bees looking for, or responding to, the same factors? To answer these questions, a forager visitation survey was conducted in the cities of Bagaces, Cañas, and Liberia, Costa Rica, focusing on the community of bees that visited T. stans resources. The recorded patterns of bee visitation were examined with respect to resource characteristics (floral abundance, height, and plant form), city size, general local landscape characteristics, and regional landscape context to determine if any other patterns became evident. Gaining a better understanding of how bee foraging strategies and behaviors manifest in cities will add valuable information to the new and growing discipline of urban bee ecology.
Materials and Methods
Site description
The cities of Liberia (10°37'47.19"N, 85°26'17.75"W), Bagaces (10°31'34.29"N, 85°15'17.73"W), and Cañas (10°25'35.95"N, 85°05'28.02"W) have developed along Central America Highway 1 in the Guanacaste province of Costa Rica. Each city is about 25 kilometers from its neighbor, separated by remnant tropical dry forest that is fragmented by ranching and agriculture. Urbanization and growth in this region are above the national average, with the population doubling in the past decade (INEC 2000). These three cities have experienced corresponding urban and peri-urban growth. The most recent national census puts the population of Liberia at 39,242 (34,469 urban; 4,773 rural), Bagaces at 9,261 (3,645 urban; 5,616 rural), and Cañas at 18,798 (16,512 urban; 2,286 rural) (INEC 2000). The area currently covered by Liberia is approximately 8 square kilometers; Bagaces, the smallest city, covers approximately 1 square kilometer; and Cañas covers approximately 3 square kilometers (urban land coverage estimated in ArcMap 9.3, © ESRI Inc. 2009). Demographic projections point to significant growth in this region; by 2015, Liberia is expected to have nearly 45,000 inhabitants, Cañas will grow to over 38,000 inhabitants, and Bagaces will double to over 22,000 inhabitants (INEC 2000). Bagaces and Liberia lie in close proximity to the biological reserve network of Lomas Barbudal and Palo Verde and are surrounded by land that is used primarily for cattle grazing. Cañas resides within an intensive crop-production region. Building density and the size of individual lots is smaller in both Liberia and Bagaces than in Cañas, but Cañas has more public green space and parks. Bagaces and Liberia are bisected by many riparian zones, but there is only one riparian corridor in Cañas.
Tecoma stans (Bignoniaceae) is common along city streets and on private land in all three cities, as well as throughout the wildlands in this region. The native range of this species in the Americas extends from the south-central and southeastern United States (Arizona to Florida) to the Antilles and down into Argentina (Hammel 2005; Zuchowski 2007). In Costa Rica, T. stans is most often found on Pacific slopes in Guanacaste province and into the central mountainous region, including the greater San José area of Puntanenas province (Hammel 2005). Individual plants can reach a height of 10 meters (Zuchowski 2007) but are commonly shorter in urban landscapes (Figure 1).
Resource Classification
The location of each plant in the study was recorded using a hand-held Garmin eTrex Vista® C GPS unit. A digital photograph was taken at each site to serve as a reference and to assist with resource height assessment. Height was estimated to the nearest 25 centimeters using either a meter measure or photographic scaling with the author (measuring 158 cm) as a reference. The T. stans individuals in this study were then grouped into three height classes: small (< 1 meter), medium (1–3 meters), and large (> 3 meters). Plant form was categorized as shrub, hedge, or tree as follows: shrubs were low-growing (generally shorter than 1 meter) individuals that lacked a clear dominant axis; hedges ranged in height and were predominantly characterized by having top-to-bottom foliage; trees had a distinct dominant axis (trunk) and a crown of foliage and flowers.
The number of flowers that an individual T. stans possessed was estimated using a stratified subsample of the inflorescences in the canopy. The canopy was fractioned into a manageable sector based on the overall resource size (either 2, 4, 8, or 10 sectors). The number of fractioned sectors was then used as an expansion factor (k) to calculate the estimated number of inflorescences (i) and the subsequent total flowers per resource (total flowers). The total number of inflorescences in one randomly selected sector was counted (i). A random subsample of the enumerated inflorescences was then selected, and the total number of flowers contained in each inflorescence was counted and averaged over the total sample (ƒ). The average number of flowers per inflorescence was then multiplied by the number of inflorescences and by the expansion factor using the following equation: total flowers = ƒ x i x k. In the case of some individual plants that possessed very few flowers, the total number of flowers was enumerated using a census. T. stans individuals were then classified into three categories of floral resource abundance: low (< 100 flowers per individual), medium (100–300 flowers per individual), and high (>300 flowers per individual).
Bee visitation assessment
Between July 2007 and March 2009, 2,088 visitation counts documenting the richness and abundance of foraging bees were conducted at 120 unique T. stans individuals across the three landscapes. A standardized 1 x 1-meter square observation frame was visually projected onto an easily observable and unobstructed area of the plant (floral resource). The visits of bees to all of the flowers within this visual frame were counted for a period of three minutes. To achieve a representative sample of overall bee visitation, counts were taken approximately every 45 minutes during the daylight hours of 6 a.m. to 6 p.m. Efforts were made to randomize the observation frames over repeated visits to each resource. A visitation was recorded only if a bee entered the corolla of the flower.
Generalized flight patterns and overall gestalt (morphology, coloration, etc.) were used to identify bee visitors "on the wing". Eleven distinguishable taxonomic categories of visitors were observed: African honey bees (Apis mellifera scutellata, abbreviated AHB), stingless bees (Trigona spp., abbreviated STB), Centris (Centris spp. and other resin bees), Eulema (Eulema spp.), Epicharis (Epicharis spp.), Euglossa (Euglossa spp.), Halictid (members of the sweat bee family Halictidae), Mesoplia (Mesoplia spp.), Melitoma (Melitoma spp.), Xylocopa (Xylocopa spp.), and small bees (when a specific identification could not be made). Abundance was recorded as the total number of individual bees that were observed per count. Taxon richness was recorded as the total number of different distinguishable taxonomic categories observed per count.
Representative samples of foraging bees were collected with aerial netting for more refined taxonomic identification. The bee collections were labeled and stored in standard solid wood entomological collection boxes. Bee identification was assisted by Laurence Packer and Jason Gibbs of York University, Toronto, Canada, and Ricardo Ayala of Universidad Nacional Autónoma de México (UNAM). The majority of the collection resides at the University of California, Berkeley Essig Museum of Entomology, with some parts at the Pollinator Partnership offices in San Francisco, California. The bee-plant interactions described here are also catalogued with the Pollinator Thematic Network and can be found by searching the bee species listed in the Appendix.
African honey bees (AHB), stingless bees (STB), members of the family Halictidae (Halictids), and bees in the genus Centris (Centris) were the dominant groups observed in this study. Statistical analysis that aimed to describe trends in functional groups focused on these four categories.
Statistical Analysis
The observed variability in abundance and taxon richness seen at Tecoma stans resources was verified using repeated measures ANOVA (nresource = 42, nrepeats = 3, α = 0.05). Visitation data were analyzed collectively as well as by city to investigate site-specific variability. Multivariate ANOVA was also used to establish if taxon richness, visitor abundance, and individual bee groups differed between the three cities studied. A Bonferroni adjusted α of 0.016 (0.05/3) was used in this comparison to adjust for Type 1 Error associated with multiple tests.
The main and interaction effects of resource characteristics (height, life-form, and floral abundance) on bee abundance, richness, and the occurrence rates of the four dominant taxon groups (Centris, Halictid, AHB, and STB) were examined using multivariate ANOVA, with a Bonferroni adjusted α of 0.016 (0.05/3) to adjust for Type 1 Error. All of the multivariate tests were further analyzed with Tukey's HSD to determine the direction and magnitude of the observed differences. To determine if there were any associations between visitation rates and city size or the surrounding landscape, the abundance, richness, and visitation rates of the individual bee groups were compared using ANOVA, α=0.05, followed by Tukey's HSD for multiple comparisons. All statistical analysis was run in SPSS 16 (Rel. 16.0.0, 2007 Chicago: SPSS Inc.).
Results
The bees observed and collected from Tecoma stans represent 27 species in 20 genera and 2 families. The species were diverse in their feeding styles, nesting habitats, and degrees of socialization (Appendix). Most visitors to T. stans in the urban landscape were solitary, ground-nesting species; however, cavity-, twig-, and wood-nesters, as well as eusocial and communal species, were present. Three groups of native bees accounted for 90.36% of the total visitors recorded: Centris, STB, and Halictid. Centris was the most abundant at 52.10%, followed by STB at 19.43%, and Halictid at 18.86%. Nonnative AHB (Apis mellifera scutellata) accounted for 5.68% of the total records. The remaining seven groups accounted for less then 2% each of the total visitors in the entire sample: Eulema, 1.12%; Xylocopa, 0.89%; Euglossa, 0.69%; Epicharis, 0.44%; Mesoplia, 0.19%; small bee, 0.16%; and Melitoma 0.15%.
Variability in individual Tecoma stans resources
Statistical tests verified the observed variability in bee attraction to individual T. stans plants to be significant. Between-resource bee variation rates were significantly different for both abundance (F1,441 = 0.005744, p = 0.000) and taxon richness (F1,441 = 0.003596, p = 0.000). Measures of within-resource bee visitor abundance and taxon richness exhibited contrasting trends. Bee abundance did not vary significantly from measure to measure on the same resource (ANOVA, F2,882 = 0.517, p = 0.596); however, the number of different bee taxa recorded per count did (repeated measures ANOVA, F2,882 = 2.329, p = 0.098). In addition, there was a significant interaction effect between measures of bee taxon richness and visitor abundance and the individual resource sampled (p < 0.000), which suggests that other variables might be structuring patterns of bee visitation to T. stans in urban landscapes.
Food resource characteristics and bee foraging
Click image to enlarge
Figure 2: The mean abundance and richness of bees attracted per count to T. stans as a function of three different resource characteristics: height (short = < 1 meter; medium = 1–3 meters; tall = >3 meters), plant form (shrub, hedge, tree), and floral abundance (low = < 100 flowers; medium = 100–300 flowers; high = >300 flowers).
Bee abundance and richness were significantly influenced only by the number of flowers that a resource had (F2,16 = 4.014, p = 0.000; F2,16 = 4.836, p = 0.000, respectively), and not by its height or plant form (Table 1). To a lesser extent, the interaction between total flowers and plant form influenced the abundance of bees visiting a resource (F4,16 = 2.063; p < 0.091), but not the total number of bee types. Figure 2 displays the general trends seen in the abundance and richness of bees observed per count as a function of resource characteristics. The three floral classes are significantly different from each other; in order of increasing floral abundance, each category attracted significantly more bees and more bee types (Tukey's HDS; p >0.05) than the one before. There was no observed variability in visitor abundance and attracted taxon richness based on the plant form. Although medium and tall resources did attract more bees and more bee types than shorter resources, this difference was not significant.
When the four dominant bee groups were examined for their individual responses to resource characteristics, more specific patterns were seen (Table 2). The foraging rates of Centris and STB were not significantly impacted by any of the resource characteristics or their interactions. The foraging rates of Halictids were impacted by the plant form and the total number of flowers possessed by a resource (F2,16 = 5.477; p < 0.005 and F2,16 = 4.764; p < 0.010, respectively), as well as by the interaction between the two (F2,16 = 5.094; p = 0.001). AHB were significantly influenced by the total number of flowers a resource had (F2,16 = 8.540; p = 0.000), and by the interaction between plant form, height, and total flowers (F3,16 = 7.472; p = 0.007). The community-level foraging patterns are likely driven by the responses of Halictids and AHB to individual resource variability.
City size and characteristics of the surrounding regional landscape
Each city had a unique bee fauna and specific patterns of forager occurrence. The mean occurrences of 9 of the 11 bee groups sampled varied significantly between the 3 cities (Table 3). Only Euglossine bees and small bees did not show any significant variation (F2,26 = 1.825; p = 0.161 and F2,26 = 2.044; p = 0.130, respectively). The size of the city had a significant impact on the number of bee taxa that were observed per count. Mean taxon richness increased significantly in the order Bagaces < Cañas < Liberia (Tukey's HSD, Bagaces: mean = 1.150, 95% CI [1.070, 1.230]; Cañas: mean = 1.368, 95% CI [1.294, 1.442]; Liberia: mean = 1.479, 95% CI [1.413, 1.545]); which is consistent with an increase in size from the smallest to the largest urban landscape (Figure 3). City size did not have a linear correlation with abundance patterns.
Click images to enlarge
Figure 3: The mean number of different bee taxa observed per three-minute count across all counts taken in the three study cities, Bagaces, Cañas, and Liberia. The cities are arranged on the x-axis in order of increasing size. In each case, there are significantly more bee types per count as city size increases (Tukey's HSD, Bagaces: mean = 1.150, 95% CI [1.070, 1.230]; Cañas: mean = 1.368, 95% CI [1.294, 1.442]; Liberia: mean = 1.479, 95% CI [1.413, 1.545]). Error bars represent the 95% confidence intervals for each measure.
Figure 4: The representative proportions of the dominant bee groups (AHB, Centris, STB, and Halictids) recorded on T. stans resources in the cities of Bagaces, Cañas, and Liberia. "Minor Groups" represents those bees that accounted for < 2% of the total abundance found at each site, and in each case included: Xylocopa, Epicharis, Euglossa, Eulema, Mesoplia, Melicta, and small bees. The dominant regional land use is indicated in brackets for each city.
There was also a relationship between taxon dominance and the greater landscape context. Figure 4 displays the community composition of bees observed in each city over the three-year study period. Bagaces and Liberia are situated within cattle ranching lands and nearer to conservation landscapes; they have similar proportions of Centris, Halictids, and STB. Cañas is situated within a more agricultural landscape and had higher numbers of Centris and STB, but lower occurrences of Halictids.
Discussion
The tropical dry forest of Costa Rica is known for its bee diversity. More than 250 native bee species are found in the wildlands of this region (Frankie et al. 1983). Mass-flowering angiosperms common to the savanna and mesic habitats provide ideal forage that supports the bee community (Frankie et al. 2004), but rapid urban growth is transforming this ecosystem. Tecoma stans resources located in the three cities studied here attracted a subsample of the wildland bee community—27 species with diverse life histories. The species visiting T. stans range in body sizes, floral usage patterns, and nesting habits. The balance of guilds attracted, proportion of the native bee community (10%) attracted, high temporal attractiveness, and annual blooming suggest that T. stans might be an appropriate target resource that can highlight trends in the local bee community. Variability in the overall attractiveness of individual trees has been established, and individual cities have been shown to have different communities of bees. The implications for sampling, monitoring, and conservation in relation to these trends are discussed in further detail.
Patterns in resource variability
The population of Tecoma stans examined showed variability in bee attraction. This to some extent can be explained by the greater landscape content within which subsamples were found, suggesting that the surrounding landscape impacts the structure of urban bee communities. At a finer resolution, individual resources within the three cities were found to vary significantly in both the number of bees and the number of bee groups attracted. Between-resource variability in bee visitation has also been documented in other local species in the family Bignoniaceae, namely, Tabebuia rosea (Frankie et al. 1982) and T. ochracea. The same is seen in some members of the family Fabaceae within this region, including Dalbergia retusa, Gliricida sepium, and Andira inermis (Frankie et al. 1997; Frankie et al. 2005a). Suggested causes include: the quantity and quality of bloom; variation in both the volume and sugar content of nectar (Kevan 2001); inconsistencies in seasonal phenology, especially advanced or delayed blooming (Frankie et al. 2005a); variability in secondary compounds found in nectar (Roubik et al. 1995); competition for pollinators in the surrounding floral community; and the characteristics of the surrounding urban matrix (Cane et al. 2006).
The foraging strategies of bees are optimized, balancing resource acquisition with competition and energy consumption. This optimization results in the development of patterns and techniques to facilitate efficient resource acquisition, including: temporal flight patterns, feeding specialization, trap-lining behavior, and resource partitioning by landscape location and vertical stratum. While vertical stratification has been suggested (Roubik et al. 1982; Roubik 1993; Gumbert and Kunze 1999), in this particular system there were no significant patterns with respect to resource height or plant form. Instead, the number of flowers that a resource possessed, a measure of resource abundance, was a significant driver of bee visitation. Resources with more flowers attracted more bees, irrespective of their height and plant form. This trend was driven, in particular, by the visitation of African honey bees (AHB) and Halictids. The visitation rates of Centris and stingless bees (STB) were not influenced by resource characteristics and structure, which is consistent with wildland studies of foraging in these species groups (Roubik et al. 1982). Contrary to the results presented here, Roubik et al. (1982) did not establish any relationship between floral abundance and bee foraging. The size of the resource patch was, however, shown to correlate with bee visitation, with larger patches receiving more visits, in studies of crop fields in England (Cresswell and Osborne 2004).
Landscape context and local bee communities
Characteristics of the surrounding urban matrix may be structuring bee visitation at different spatial scales. Bagaces and Liberia have the most similar patterns of bee visitation, and both are situated within similar regional land use: cattle grazing in modified grasslands punctuated by native dry forest. Nearby are the biological reserve systems of Lomas Barbudal and Palo Verde. Cañas is different, sitting in the center of agricultural intensification. On a finer scale, Bagaces and Liberia are interspersed with more streams and riparian areas than Cañas. A more refined species-specific analysis of the bee communities would reveal if there are more substantial trends in taxon presence and absence in urban areas located within different landscapes. An initial study of urban landscapes across California conducted by Frankie et al. (2009b) indicated that the species attracted to a set of targeted ornamental plants differed between individual cities, even between those located within similar ecoregions.
The community of bees at a locality is determined by history, context, and current management practices. Historical presence/absence records are not always available for a site, and this is the case for the cities of Bagaces, Cañas, and Liberia. The bee species that occur in urban landscapes can be a mix of local natives migrating in from the wildland, generalists that are successful in novel landscapes, or introduced exotics (a common species group in urban areas due to the influence of active and passive human introductions). Patterns in richness are likely driven by the sporadic occurrence of rare species. Attempts to more adequately catalogue species richness will require more extensive sampling over a four- to five-year period, due to both natural variability in pollinator populations (see Eardley et al. 2006 and the 2007 NRC report Status of Pollinators in North America) and large-scale cycles of seasonal bee variability, which are common to the tropics (Frankie et al. 2005a and 2009a).
Finer-scale investigations of urban systems
Urban landscapes have been shown to be acceptable and appropriate habitats for some species of bees. The diversity and importance of bee communities found within cities present opportunities for conservation and management. The management of ecological systems, however, requires an intimate knowledge of ecosystem-level function and species-specific biology. Further comparisons between different urban landscapes and within the heterogeneous urban matrix are also necessary. Studies that examine more than one land-use type are limited in the literature. Only four studies of urban bees have considered multiple cities (Dreistadt et al. 1990; Porrini et al. 2003; Frankie et al. 2005a; Frankie et al. 2009a), and only one was a meta-analysis that attempted to integrate information across multiple landscapes (Cane 2005).
Urban landscapes do share many similar ecological characteristics in terms of land-use patterns and disturbance regimes, but they are also situated within different ecological regions. It is unclear if there are larger congruent trends in bee ecology between different urban landscapes, and if these trends are globally consistent. The variability in the patchwork of land-use types that makes up the urban landscape must also be examined in more detail to determine if small-scale, local factors influence the success of bees in modified landscapes. Smaller bodied species such as bees respond to scale-dependant factors, and an appropriate understanding of bee ecology within any landscape requires local-scale investigations. The next step in urban bee foraging ecology will be to outline microhabitat elements and small-scale variability within the urban matrix and to determine their impact on bee occurrence and community structure.
Acknowledgments
Funding was provided by the Margaret C. Walker Fund in partnership with the Essig Museum of Entomology at the University of California-Berkeley. I am very grateful to Laurence Packer and Jason Gibbs of York University, Toronto, Canada, and Ricardo Ayala of UNAM, for their assistance with specimen identification. I would like to thank Laura Fine and Meaghan Jastrebski, who provided field assistance and good company throughout the dry season. Additionally, the hospitality of the Sandoval-Argon family made the research experience wonderful.