PUBLISHED: IN PRESS

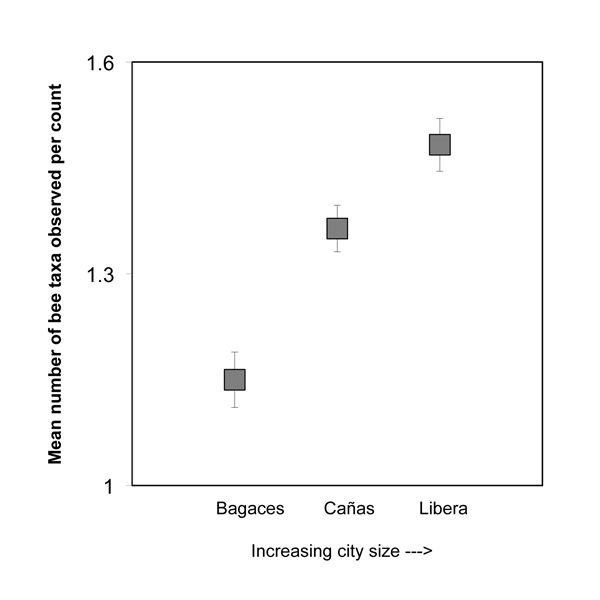
Figure 3: The mean number of different bee taxa observed per three-minute count across all counts taken in the three study cities, Bagaces, Cañas, and Liberia. The cities are arranged on the x-axis in order of increasing size. In each case, there are significantly more bee types per count as city size increases (Tukey's HSD, Bagaces: mean = 1.150, 95% CI [1.070, 1.230]; Cañas: mean = 1.368, 95% CI [1.294, 1.442]; Liberia: mean = 1.479, 95% CI [1.413, 1.545]). Error bars represent the 95% confidence intervals for each measure.