
Baltimore Birdscape Study: Identifying Habitat and Land-Cover Variables for an Urban Bird-Monitoring Project
by Charles H. Nilon1, Paige S. Warren2, and Jordan Wolf3
1 Department of Fisheries and Wildlife Sciences, 302 Anheuser-Busch Natural Resources Building, University of Missouri-Columbia, Columbia, MO 65211
2 Department of Natural Resources Conservation, University of Massachusetts Amherst, Amherst, MA 01003
3 Flushing International High School, 144-80 Barclay Avenue, Flushing, NY 11355
Abstract
As the first step in developing a long-term citywide bird-monitoring project in Baltimore, we sought to identify how bird species composition and abundance might be related to vegetation variables and land-use/land-cover variables that are being collected to assess neighborhood change in Baltimore. In May through June 2002 we counted birds at 46 randomly located census points in Baltimore. We collected data for 15 vegetation variables along a 100-meter transect located on streets containing the bird census points. We measured seven land-use/land-cover variables in a 200-meter-radius circle centered on each census point. We used principal component analysis to identify vegetation and land-use/land-cover variables that explained differences among bird census points. We used canonical correspondence analysis (CCA) to help us understand the relationship between urban bird communities and vegetation and land-use/land-cover variables and to identify bird species that might be useful indicators of changes in urban neighborhoods. Our study recorded one-third of the bird species that occur in the region during the breeding and summer seasons. We identified a subset of bird species whose abundance values are correlated with vegetation and land-use variables and may be useful in long-term monitoring projects where the objective is to relate bird species abundance and presence to measures of how urban neighborhoods change.
Keywords: birdscape, urban, monitoring, neighborhoods, conservation, Baltimore Ecosystem Study
Introduction
Citywide bird-monitoring projects are an important part of urban wildlife conservation programs and research on urban ecosystems (Dinetti et al. 1996; Hadidian et al. 1997; Germaine et al. 1998; Hostetler & Knowles-Yanez 2003; Turner 2003). A number of key ecological and management questions can only be addressed with long-term monitoring data. For example, many species exhibit delayed responses to changes in habitat conditions associated with urban development (Geis 1980). Typical study durations of 2 to 3 years are not sufficient to identify these response times. Bird-monitoring projects have been useful in making comparisons among the avifauna of cities (Dinetti et al. 1996) and in providing insight on patterns of change in urban avifauna over time (Luniak 1996; Nowakowski 1996). Development of an effective temporal monitoring program, however, must capture the predominant features of spatial variation. We report here on a pilot study to determine the key habitat and land-cover variables to use in establishing a long-term, citywide bird-monitoring program in Baltimore.
In contrast to the typical focus of biodiversity studies, citywide monitoring projects focus on all portions of a city, not just natural and seminatural habitats. This broader focus provides additional understanding of what Kaplan et al. (1998) refer to as "everyday nature," the biodiversity that is experienced by people near where they live and work. This and the relatively small scale at which data are collected make monitoring projects useful in studying the influence of social, economic, and demographic change on biodiversity (Kinzig et al. 2005).
As participants in the Baltimore Ecosystem Study (BES) we seek to understand how cities change over time and how these changes influence bird species composition and abundance (Pickett et al. 2001). Bird habitats in cities are shaped by decisions made by residents, property owners, developers, planners, design professionals, and elected officials. Changes in bird habitat and resulting changes in bird species composition and abundance are driven by this decision making. As the first step in developing a bird-monitoring program for BES, we aim to identify variables and combinations of variables that describe vegetation and land-use/land-cover characteristics that reflect these decisions and are correlated with bird composition and abundance. These variables are a subset of a larger group of variables used by BES researchers who study changes that occur in the Baltimore neighborhoods where we study birds.
In 2002, we conducted a one-year initial bird survey in Baltimore. We also collected habitat data at the homeowner and neighborhood level in order to address the significant, aggregate ecological impact that human activities at these scales can have. Our study addressed three questions:
- What is the pattern of bird species composition and abundance among a random sample of bird census points in Baltimore?
- Are vegetation variables that explain differences among bird census points good predictors of bird species abundance?
- Are land-use/land-cover variables that explain differences among bird census points good predictors of bird species abundance?
Both the vegetation variables and the land-use/land-cover variables we measured involve relatively accessible data that can be implemented quickly in other cities. Thus, the exploratory analysis we report here could serve as a model for developing long-term avian-monitoring programs in other urban areas.
Methods
Study Area
Our study was conducted in Baltimore (209.3 km2 or 22540 ha). Baltimore is a port city and is also located along the transition between the coastal plain and Piedmont ecological regions of North America (Ellis et al. 2006). Thus, the city boundaries encompass three ecological zones, two terrestrial and one aquatic, within a relatively small area. These ecological zones have now been overlaid and modified through more than two and a half centuries of urbanization. Between 1950 and 1990, total population and population density changed significantly in the Baltimore region due to movement of city residents from the city into adjacent Baltimore County. Baltimore City's total population declined from a high of approximately 1.4 to 0.75 million, leading to significant turnover in land use within the city. A key goal of the BES long-term monitoring program is to understand the effects of these human demographic changes on avian habitat structure.
Bird Count Protocol
Click image to enlarge
Figure 1: Variation in abundance of rock pigeon at bird census points in Baltimore. Sizes of circles represent the mean number of individuals detected over three point counts, May through June 2002.
A modified a protocol developed by Hadidian et al. (1997) was used to select our bird census points. We placed a grid with 500-meter spacing over the U.S. Census Bureau (2005) TIGER file for Baltimore City. A total of 823 points were within the boundaries of Baltimore City. We selected a random sample of 50 points for this study (Figure 1).
Our protocol for conducting bird counts was designed to match a procedure developed for the Central Arizona-Phoenix Long-Term Ecological Research Project (CAP LTER) in order to maximize intercity comparability (Hope et al. 2004; Kinzig et al. 2005; Walker et al. 2008). One trained observer visited each point between 05:30 and 09:30 on May 15 through July 20, 2002. The observer recorded the species and number of all birds seen or heard during a five-minute counting period. Three counts were made at each point. The values were averaged and an index value of mean detections/count was reported.
Vegetation Variables
Social scientists working on the Baltimore Ecosystem Study use variables such as vegetation, home type, presence of trash and garbage, home-security features, and property maintenance to describe neighborhood characteristics and neighborhood change (Weiler and Freedman, unpublished). These variables are measured from 100-meter transects located on streets in Baltimore neighborhoods. We measured 15 of the vegetation features used in assessing neighborhood quality which we predicted might be associated with bird species occurrence and abundance along a 100-meter transect centered at the bird census point (Table 1). An observer walked along the transect and made a visual estimate of the 15 variables on both sides of the transect. Principal component analysis was used to identify combinations of vegetation variables that explained at least 60% of the differences among the bird census points. Five bird census points were not located on streets and were not included in this analysis.
Land-Use/Land-Cover Variables
The 1997 Maryland Mid Resolution Land Cover (MRLC) data for Baltimore was used to identify land use/land cover within a 200-meter radius surrounding each bird census point. These data were compiled by the U.S. Environmental Protection Agency as part of a project to describe land-use/land-cover patterns in the eastern United States and have been used by other BES researchers interested in understanding how land use and land cover influence urban ecosystem properties (Pouyat et al. 2007). Arc View software was used to create a 200-meter-radius buffer around each census point and measured the percentage of each of seven cover types within the buffer (Table 1). Principal component analysis was used to identify combinations of MRLC variables that explained at least 60% of the differences among the bird census points.
Identification and Description of Bird Communities
Two canonical correspondence analyses were used to relate bird species composition and abundance data to vegetation variables and land-use/land-cover variables that explained differences among bird census points (McCune and Mefford 1999). Our use of canonical correspondence analysis (CCA) was appropriate for this study because we were interested in how well bird community data fit two types of data used to describe differences among Baltimore neighborhoods, or what McCune and Mefford (1999) describe as how well community data fit environmental variables. In our first CCA, we used scores for the principal component axes that explained at least 60% of the variation among census points with vegetation variables as environmental variables. The scores for the principal component axes that explained at least 60% of the variation among census points with land-use/land-cover variables were used as environmental variables in our second CCA. We used species scores on the first two axes of the CCA to identify species that were important in describing the ordination. Species that were positively or negatively correlated (r ≥ 0.05) with the first two ordination axes were selected as indicator species describing the ordination (McCune and Mefford 1999).
Two cluster analyses to identify bird species groups defined by the canonical correspondence analyses. Ward's minimum variance technique and the nearest neighborhood clustering algorithm were used on separate cluster analyses of scores of the first two canonical correspondence analyses axes using bird/vegetation and bird/land-use/land-cover data. A chi-square test of independence was used to determine if the two classifications were independent.
Results
Bird Species Composition and Abundance
Forty-five species were detected on the 46 points where we conducted counts in 2002 (Table 3). A first-order jackknife estimate predicted that 54.8 species occurred among the points. Nine species, European starling (Sturnus vulgaris), house sparrow (Passer domesticus), chimney swift (Chaetura pelagica), rock pigeon (Columba livia), common grackle (Quiscalus quiscula), northern mockingbird (Mimus polyglottos), American crow (Corvus brachyrhynchos), mourning dove (Zenaida macroura), and American robin (Turdus migratorius), were detected on at least 50% of the points. Nine species—black-crowned night heron (Nycticorax nycticorax), brown thrasher (Toxostoma rufum), Canada goose (Branta canadensis), eastern bluebird (Sialia sialis), Iceland gull (Larus glaucoides), tree swallow (Tachycineta bicolor), tufted titmouse (Baeolophus bicolor), turkey vulture (Cathartes aura), white-breasted nuthatch (Sitta carolinensis), and wood thrush (Hylocichla mustelina)—were detected on only one of the census points. An average of 12.4 species were detected on each point. Species richness/point ranged from 6 to 19 species.
A mean of 0.5 (STD = 0.7) birds of each species were detected at each point. Five species had abundance values greater than 2.0 detections/point: European starling, house sparrow, rock pigeon, chimney swift, and common grackle. Abundance values differed among points for both rare and common species (Figure 1).
Vegetation Variables Explaining Differences Among Bird Census Points
Three principal components explained 61% of variation among the vegetation variables collected along 100-meter transects at each bird census point, hereafter referred to as vegetation principal components (Table 2a). The first vegetation principal component, explaining 34% of the variation, had positive loadings for variables indicating presence of vegetation around houses: housing units with trees, housing units with shrubs, housing units with perennial vegetation, housing units with annual vegetation, and housing units with grass. The second vegetation principal component, explaining an additional 16% of variation, had strong loadings for number of hedges and number of shrub hedges. The third vegetation principal component, explaining an additional 12% of the variation, had a positive loading for number of housing units and negative loadings for number of trees and number of yards with trees and hedges. Thus, the three axes can be interpreted as: (PC1), a gradient in the presence of vegetation, from few housing units with vegetation to all housing units with vegetation; (PC2), a gradient in the kind of vegetation from few manicured shrubs to many; and (PC3), a gradient in housing density and vegetation cover from high housing density and low vegetation cover to low housing density and high vegetation cover.
Bird Community Characteristics and Vegetation Variables
Click image to enlarge
Figure 2: Results of canonical correspondence analysis (CCA) using bird species abundance values and scores for the first three vegetation principal components. Species that occur together on bird census points are grouped together in the figure. Principal component 1 and principal component 3 were correlated with the ordination axes.
The CCA using the first three vegetation principal component axes explained 9% of the variance in bird species data (Figure 2). The first CCA axis explained 5.8% of variance in species data. The herring gull (Larus argentatus) (r = 0.562) and ring-billed gull (Larus delawarensis) (r = 0.500) were correlated with axis 1 and selected as indicator species for this axis. The second CCA axis explained 2.2% of variance in species data. The chimney swift (r = 0.722) was correlated with axis 2, and was selected as an indicator for this axis. Vegetation principal component 1 was positively correlated (r = 0.619) and vegetation principal component 3 was negatively correlated (r = -0.736) with axis 1. Thus, over half of the variation in bird communities that is accounted for by vegetation variables is associated with PC1 and PC3, both of which reflect gradients in vegetation cover, particularly tree cover. Species scoring high on this canonical axis thus appear to be linked to high vegetation cover and low housing density. All three habitat principal components were negatively correlated with axis 2 of the CCA (PC1: r = -0.582; PC2: r = -0.540; PC3: r = -0.654). Thus, species scoring high on canonical axis 2 are associated with low vegetation cover, but also low housing density.
The cluster analysis of bird species using the first two bird-habitat CCA axes resulted in four clusters (Table 3). The first cluster was dominated by species typically found in inner-city residential areas. The second cluster was a mix of species not associated with residential habitats but with riparian and shoreline habitats. Species associated with single-family residential neighborhoods (scoring high on canonical axis 1) dominated the third cluster. The fourth cluster was small with two species associated with mature trees, chipping sparrow (Spizella passerina) and tufted titmouse.
Land-Use/Land-Cover Variables Explaining Differences Among Bird Census Points
Four principal components explained 72% of the variance in land-use/land-cover variables for the 200-meter-radius area surrounding each bird census point, hereafter referred to as LULC principal components (Table 2b). The first LULC principal component, explaining 22% of variation among bird census points, had positive loadings for low-intensity development and herbaceous cover and negative loadings for high-intensity residential development, indicating a separation of bird survey points in a matrix of single-family residential areas and open spaces from those in a matrix of high-density residential and commercial areas. The second LULC component explained an additional 18% of variation and had positive loadings for lawn and forest land cover and negative loadings for commercial/industrial land uses. Thus, LULC principal component 2 indicates a separation between bird census points in a matrix with residential yards and greenspaces from those dominated by commercial and industrial land uses. The third LULC component, explaining an additional 17% of variation among the bird survey points, had a positive loading for commercial/industrial land use and a negative loading for high-intensity residential developments. The fourth and final component explained 14% of the variation among the bird census points and had negative loadings for water and herbaceous cover.
Bird Community Characteristics and Land-Use/Land-Cover Variables
Click image to enlarge
Figure 3: Results of canonical correspondence analysis (CCA) using bird species abundance values and scores for the first four bird land-use/land-cover principal components. Species that occur together on bird census points are grouped together in the figure. Principal component 1 and principal component 3 were correlated with the ordination axes.
The CCA using the first four LULC principal component axes explained roughly the same proportion of variance in bird species (10.5%) as did the habitat CCA. The first LULC CCA axis explained 6.3% of variance in bird species abundance values (Figure 3). Two species, the barn swallow (Hirundo rustica) (r = -0.564) and herring gull (r = -0.621), were correlated with the first axis and were selected as indicator species for this axis. LULC principal component 2 (matrix with residential yards and greenspaces vs. matrix dominated by commercial and industrial land uses) was positively correlated (r = 0.546), and principal component 3 (positive loading for commercial/industrial land use and a negative loading for high-intensity residential developments) (r = -0.649) and principal component 4 (negative loadings for water and herbaceous cover) (r = -0.505) were negatively correlated with the first CCA axis. Thus, species scoring high on the first LULC CCA axis, accounting for more than half of the total variation explained by the CCA, should be species associated with residential areas and green spaces with water and herbaceous cover, but not with commercial/industrial areas.
The second LULC CCA axis accounted for the remaining 4% of variance in bird species abundance. Two species, chimney swift (r = 0.506) and rock pigeon (r = 0.508) were correlated with the second axis and were selected as indicator species for this axis. LULC principal component 1 (positive loadings for low-intensity development and herbaceous cover and negative loadings for high-intensity residential development) was strongly negatively correlated (r = -0.926) with this axis. Thus, species scoring high on this CCA axis are associated with high-intensity residential development.
The cluster analysis of bird species using the first two bird land-use/land-cover CCA axes resulted in three clusters (Table 3). The first cluster included a group of species commonly found in urban residential areas. The second cluster was a group of species associated with open woodlands and residential areas with mature trees. The third cluster of species was a mixed group of species using wetland habitats and open areas.
Identification of Urban Bird Groups
Our analysis of the bird species clusters developed from two different classifications revaled that the two sets of clusters are significantly associated with one another (chi-square = 35.9, 6 df, p > 0.0001). We used the results of the classifications and information analyses of habitat and land-use/land-cover data to define a group of four urban bird groups that we hypothesize to occur in Baltimore (Figure 4).
Discussion
Click image to enlarge
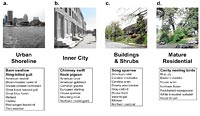
Figure 4: Bird groups and their indicator and associated species identified during the monitoring project.
One goal of this one-year exploratory study was to understand patterns of bird species composition and abundance in the day-to-day settings where most Baltimore residents encounter birds. We designed our study to answer questions about bird species composition and abundance and about the ability of variables that describe features of neighborhoods to serve as correlates of species richness and species abundance. The answers to the questions were used in designing a bird-monitoring project that started in 2005. Our analyses reveal clustering of birds into different urban bird communities, and they identify several potentially important habitat and land-use/land-cover associations that will be used to guide long-term bird monitoring in Baltimore (Table 3, Figure 4).
Patterns of Bird Species Composition and Abundance
Across a random sample of bird census points covering Baltimore City, we detected 46 species. A breeding bird atlas for Baltimore City and Baltimore County recorded 130 species during the breeding season, indicating that our random points detected roughly one-third of the species in the region (Ringler 1978). Hadidian et al. (1997) recorded 91 species in Washington, DC, 48 kilometers southeast of Baltimore. Ringler (1978) and Hadidian et al. (1997) counted birds in residential and commercial land uses similar to our study. They also counted birds in forests and parks, habitats that were not included in our random sample. In addition, the short-term nature of our study, the relatively small number of bird census points, and the random selection of bird census points likely underestimates the total number of species occurring in urban habitats in Baltimore. Ongoing long-term monitoring will help determine more accurately what proportion of the region's bird fauna are present in Baltimore.
Our findings are similar to those of other urban bird-monitoring studies in the U.S. that documented a small number of species that occur on the majority of census points (Hadidian et al. 1997; Hostetler and Knowles-Yanez 2003; and Turner 2003). A subset of these frequently occurring species also have high abundance values. Hadidian et al.'s (1997) list of most frequently occurring species in Washington, DC (European starling, house sparrow, chimney swift, rock pigeon, common grackle, northern mockingbird, American crow, mourning dove, American robin), were the most frequently occurring species in our study.
Habitat Variables, Land-Use/Land-Cover Variables, and Distribution of Bird Species
One of our goals in developing a bird-monitoring project is to identify variables at a household or block level that reflect management decisions made by planners, developers, and residents and can be used to explain patterns of bird species composition and abundance. We found that two components of block-level habitat variables—vegetation in yards and number of housing units vs. number of trees—were correlated (r > 0.05), with ordination axes describing differences in bird communities. The components we identified, and the individual variables associated with them are consistent with literature on differences in urban neighborhoods that influence difference in urban bird communities. Geis (1980) described differences in northwest Baltimore, where he did bird counts as "older neighborhoods with dense vegetation" versus "open residential neighborhoods with few trees." These neighborhoods differed in bird species composition and abundance. Williamson and DeGraaf (1981) documented similar differences among urban bird habitats in Washington, DC. These differences in block-level habitat features and the bird communities associated with them may be related to socioeconomic factors that influence residents' landscaping decisions (Williamson and DeGraaf 1981; Kinzig et al. 2005). They may also be related to differences in Baltimore between older neighborhoods that developed in the coastal plain with higher building densities and smaller yards versus more recently developed neighborhoods (ca. 1880–1940) in the Piedmont ecological region with remnant forest vegetation and larger yards (Ellis et al. 2006).
We asked if bird community data are correlated with land-use/land-cover variables that explain differences among bird census points. The variables that describe differences among census points, specifically differences between low-density residential neighborhoods and other land uses, were similar to those described by Hadidian et al. (1997) for bird/land-use relationships in Washington, DC.
The bird community data in our study were a poor fit to both the habitat and land cover principal components. This may be due to the small number of bird census points and the random selection of census points in our preliminary study.
Implications for Urban Bird-Monitoring Projects
The results of our one-year study led to modifications in our protocol that we feel may be applicable to other urban bird-monitoring projects. Our bird census points were relocated to the 202 Urban Forest Effect Model (UFORE) points in Baltimore City. The UFORE points are part of a protocol for measuring vegetation in U.S. cities, and the Baltimore points are stratified among eight land-use types (Nowak et al. 2004). We selected a stratified random sample of UFORE points for use in the bird-monitoring project. This stratified random sampling allows us to retain our focus on birds in day-to-day environments, but it affords a better reflection of the distribution of land uses within the city.
Our study documents differences in patterns of bird abundance in what are often thought of as generalist species (Figure 2). The ability of habitat and LULC variables to serve as predictors of abundance for a number of so-called generalist species suggests that changes associated with decisions made by planners and residents influence species use of urban habitats. Recent research on generalist species in European cities points to the detailed type of research needed to confirm the relationship between variations in abundance and impacts on populations of generalist species (Mennechez and Clergeau 2006).
Our study also documents groups of birds associated with different areas of the city (Table 3, Figure 4). A focus on monitoring inner-city areas, mature residential neighborhoods, and shorelines as places that have unique characteristics and distinct bird communities is important because it provides a way of linking the ecological characteristics of these areas to the dynamic social, cultural, and economic factors that shape how cities change over time.
Acknowledgements
This project was conducted as part of the Baltimore Ecosystem Study (BES) and supported by the National Science Foundation Long-term Ecological Research program (grant number DEB 0423476).