
A Vegetation Survey of Teaneck Creek Wetlands
by Beth Ravit1, Linda Rohleder2, Lea Johnson2, Joan Ehrenfeld3, and Peter Kallin4
1Department of Environmental Sciences, Rutgers University, New Brunswick, New Jersey 08901
2Graduate Program in Ecology and Evolution, Rutgers University, New Brunswick, New Jersey 08901
3Department of Ecology, Evolution and Natural Resources, Rutgers University, New Brunswick, New Jersey 08901
4Belgrade Regional Conservation Alliance, P.O. Box 250, Belgrade Lake, Maine 04918
Abstract
A project goal for the restoration of Teaneck Creek wetlands is to establish native plant communities within these rehabilitated wetland areas and to eliminate or control the spread of invasive plants. To determine the location of the existing native vegetation and to characterize the substrate quality (native hydric soils versus fill materials) and moisture (wet versus dry) associated with this plant community, we visually identified and ranked the abundance of the flora on the site. Using the New Jersey Coefficient of Conservatism (NJ CC), we calculated a Floristic Quality Assessment Index (FQAI) for twenty-nine 100-meter by 100-meter sampling units. Plant diversity was found to be high (245 species) compared to other New Jersey urban wetlands, and native species comprised 60% of the total number of plant species observed. Two thirds of the total number of tree and shrub species were native, while only half the vine/forb/herb species were native. Introduced species were found to have invaded a minimum of 30% of each sampling unit and a maximum of over 50% in a Phragmites-dominated interior area, where plant diversity was the lowest seen on the site. The ten highest FQAI-value native species were predominantly wetland plants. A comparison of the FQAI value with the soil type and moisture properties indicates that wet soils may be the more important of the two variables in structuring the existing vegetation at this site. The FQAI score identified a high quality wetland area that must be guarded from disturbance during restoration activities. The FQAI score, in combination with soil properties and/or moisture content, will be used to inform the decision-making process as the Teaneck Creek wetland Conceptual Restoration Plan is developed.
Keywords: Urban, wetland, native, invasive, Floristic Quality Assessment Index, diversity, restoration, hydrology, Conceptual Restoration Plan
Introduction
Click image to enlarge
Figure 1: A map of New Jersey showing the location of the Teaneck Creek Conservancy restoration site.
Existing vegetation on the 46-acre Teaneck Creek Conservancy wetland site (Figure 1) consists of a mixture of native and introduced plant species. Many of the non-native species, such as garlic mustard (Alliaria petiolata), Japanese knotweed (Polygonum cuspidatum), mile-a-minute vine (Polygonum perfoliatum), and multiflora rose (Rosa multiflora), are aggressively invasive and have formed monospecific expanses in certain areas of the site. Overall goals for rehabilitation of the site include reestablishing the hydrologic connectivity between Teaneck Creek and its interior surface and ground waters, and the removal of fill materials, resulting in reestablishment of 20 acres of wetlands. Specific project goals include the establishment of native wetland flora typically found in northern New Jersey riparian corridors, the protection of existing native plants growing in hydric soils, and the elimination of invasive vegetation within these wetland areas. Although this is not the usual definition of restoration, for the sake of simplicity, we will use this term to refer to these project goals.
As an aide in characterizing the site, we utilized a Floristic Quality Assessment Index (FQAI) to describe and evaluate the existing flora (Lopez and Fennessey 2002). The FQAI has been adopted in several other geographic locations for the purposes of wetland assessment (Mushet et al. 2002; Cohen et al. 2004; Bourdaghs et al. 2006; Miller and Waldrop 2006). It is used to characterize the conservation value of multiple site locations that potentially may be altered by restoration activities. This methodology assigns a subjective ranking called a "coefficient of conservatism" (CC) to each plant species. Species more likely to be found in natural areas are assigned higher numbers, while species commonly found in disturbed areas are given lower numbers (Matthews et al. 2005).
Using the values obtained in the FQAI characterization, the restoration approach will prioritize high FQAI-value areas that should remain undisturbed during and following wetland restoration on the site. Low FQAI-value areas will be considered as candidates for hydrologic and soil restoration activities followed by subsequent replanting with native species. We also used the FQAI value to test whether hydrology and/or soil properties were factors in determining the vegetation patterns observed.
Methods
Field Sampling
Click image to enlarge
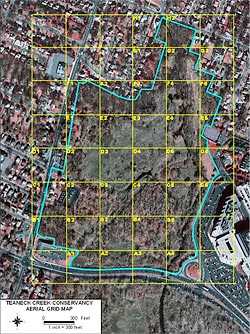
Figure 2: Teaneck Creek Conservancy (site outlined in blue) aerial map overlain with 100 m × 100 m sampling unit cells. Map courtesy of Bergen County.
In order to obtain a coarse-scale view of the vegetation on the Teaneck Creek Conservancy site at a resolution of 1 hectare, we established a grid system (100-meter by 100-meter sampling units) and overlaid it onto an aerial GIS based map of the site (Figure 2). Sample units were labeled from south to north with alphabetic letters and from west to east with numbers. Each unit was visited at least twice during the summer and fall of the 2006 growing season, beginning in late May and ending in early November. Sampling activities were performed by a single observer who made multiple traverses within each sampling unit, recording plant species present and visually estimating coverage of each species. We note the following difficulty in data collection: Although our objective was to traverse each sample unit completely, due to the density of invasive vegetation and the presence of standing water, there were portions of the interior areas which were not totally accessible. In these cases, the observer traversed as much of the sample unit as was physically possible, but our data may contain sampling errors as a result of these physical limitations.
Observers made a visual estimate of plant abundance based on the percent cover of each species visible within the sample unit. A scored five-level scale was employed: The lowest score (1) = "rare" was assigned if the species occurred as a single plant, or only a few individuals, or if the populations were very small and highly localized. A species was scored as (2) = "few" if it occurred in several small populations throughout the unit, or as many isolated individuals that constituted less than 10% of the overall cover. A species was scored as (3) = "occasional" if it contributed approximately 10% to 40% of the total cover, or if it occurred in several substantial populations within the unit. Species that occupied 40–60% of the sampling unit, or that were distributed as individuals throughout the unit in virtually all locations were scored as (4) = "common." Species that constituted > 60% of the total unit cover were scored as (5) = "abundant." The highest abundance level attained by a species throughout all sampling events was retained when data from all site visits were consolidated.
After the vegetation in each sampling unit was identified, we obtained the New Jersey coefficient of conservation (NJ CC) for each species (Bowman 2006). This coefficient describes the habitat requirements for a particular species, including its sensitivity to disturbance (Matthews et al. 2005). Coefficient values ranged from 0 to 10, and introduced plants are always assigned a 0. The NJ CC for all species within a sample unit was then used to calculate a Floristic Quality Assessment Index (FQAI) for each sampling unit cell.
Soil and Moisture Properties
Dr. Kallin assigned a wetness rating to each sampling unit cell based on the dominant hydrologic condition(s) observed while performing the site's wetland delineation (Ravit et al. this volume). This characterization was based on the presence of saturated soil, inundation, hydric soil criteria, water table data, and a visual determination as to the proportion of the sample unit that met hydric soil criteria, with (1) = primarily wet (> 60%); (2) = primarily dry (< 40%); (3) = mixed (40–60%). This was based on criteria in the Federal Manual for Identifying and Delineating Jurisdictional Wetlands (FMIDJW 1989). Utilizing multiple soil borings in each sampling unit, Dr. Kallin also characterized the soil quality with respect to the type and source of the dominant substrate material(s), assigning values as (1) = primarily native soil; (2) = primarily dredge fill; (3) = primarily dredge fill with debris; and (4) = mixed. The use of the term "native" describes non-fill substrate that exhibited soil horizons and textures indicative of a native glacial soil and that had native vegetation growing in the surrounding area. A visual evaluation of each sampling unit was also conducted.
Statistical Analysis
Click image to enlarge
Figure 3: Dominant soil moisture property of each Teaneck Creek 100 m × 100 m sampling unit.
All analyses of variances (ANOVAs) were conducted using SAS System GLM (SAS Software, Version 9.1). Due to the high level of heterogeneity on this site as a result of anthropogenic disturbances, we set the threshold for significant differences between sampling units at the α = 0.10 level. We acknowledge that this choice was somewhat arbitrary, but due to the heterogeneity and the fact that there were only 28 sample units, we opted to use a less restrictive alpha test. Due to the coarse scale of the sampling in this study, and because the Simpson Diversity Index is weighted toward abundances of the most common species, we used this index to determine plant species diversity (PC-Ord, Version 4). ANOVA was used to test for differences in the diversity scores among the sampling units, and two-factorial ANOVAs (Independent Variables = MOISTURE × SOIL, Dependent Variable = FQAI score) were used to test if there were interactions that might influence the FQAI value. We note that the FQAI value is not an abundance measure, and so weighs the presence of rare and common species equally. Conversely, the Simpson Diversity Index is weighted toward abundance of the most common species (Magurran 1988), and so better describes the presence of dominant invasive monocultures.
Results
Overall, the number of plant species found on the Conservancy site was high compared to other New Jersey urban wetlands (Ehrenfeld 2005). A total of 245 plant species (contact author for full plant list) were identified within the Teaneck Creek Conservancy, and all species observed have been reported as present in the New York metropolitan region (Clemants and Moore 2003). The number of species within a given sample unit ranged from a low of 20 to a high of 83, with a mean per sampling unit of 50 species (Table 1). Of the plants identified, 145 were native species and 98 were species that have been introduced to this area.
Click image to enlarge
Figure 4: Dominant soil properties of each 100 m × 100 m Teaneck Creek sampling unit.
Thirty-three species were observed in more than 50% of the sampling units (Table 2). The 4 most widely distributed species, found in over 90% of the sampling units, included common reed (Phragmites australis), garlic mustard (Alliaria petiolata), porcelainberry (Ampelopsis brevipedunculata), and multiflora rose (Rosa multiflora), which are all considered invasive. We note that although Phragmites australis can be categorized as a native species (Clemants and Moore 2003), there is a genotype which originated outside the U.S. that has invaded and replaced native genotypes throughout eastern coastal marshes (Saltonstall 2002). Although the plant found on the Conservancy site has not been genetically tested, because the invasive genotype dominates the nearby Hackensack Meadowlands ecosystem, we are assuming that our plant is the invasive form, and so have treated it as nonnative in our analyses. All the sample units were heavily invaded by nonnative species, although the number of widely distributed native species (19) was slightly greater than the number of widely distributed introduced species (13). Across the entire site, more than 40% of the species identified were nonnative, and five sample units had more than 50% nonnative species cover. Trees and shrubs exhibited the highest proportion of native species (approximately two thirds of the total number identified) as compared to vines and forbs (approximately half the species were native). The most commonly observed native plants tended to be wetland species, while the highly distributed introduced plants were predominately upland species.
Click image to enlarge
Figure 5: Floristic quality of each 100 m × 100 m Teaneck Creek sampling unit.
The ratio of the numbers of native versus introduced species per sample unit ranged from 0.7 to 2.4, with a mean of 1.5 (Table 3). This ratio was higher under wet (Figure 3) versus mixed or dry conditions (F2,25 = 2.46, p = 0.1), suggesting that wetter hydrology may favor native species. The top ten high NJ CC value native plants were wood bulrush (Scirpus expansus) (obligate wetland, or OBL); hobblebush (Viburnum alnifolium) (wetland or upland, or FAC); bitternut hickory (Carya cordiformis), (facultative upland, or FACU); smartweed (Polygonum amphibium var. emersum) (OBL); wild leek (Allium tricoccum) (FAC+); spring cress (Cardamine bulbosa) (OBL); American linden (Tilia americana) (FACU); false hellebore (Veratrum viride) (facultative wetland, or FACW+); swamp white oak (Quercus bicolor) (FACW+); and wild yam (Dioscorea villosa) (FAC+). Except for American linden and bitternut hickory, these species are all obligate or facultative wetland species.
Soil quality was highest in the sampling units at the northern end of the property and in portions of the eastern and western borders (Figure 4), where the soils were composed of primarily native organic material. The interior of the site was dominated by dredged materials, and the soil adjacent to the southern boundary is unconsolidated fill/debris. However, the soil type was not found to be a significant factor in determining the number of plant species, the ratio between native versus introduced species, or the FQAI score within a sampling unit. A two-factor ANOVA comparing the FQAI values found no interactions between moisture and soil type.
Click image to enlarge
Figure 6: Plant species diversity score for each 100 m × 100 m Teaneck Creek sampling unit as measured by the Simpson Diversity Index.
The highest quality FQAI sampling units were located at the northeastern portion of the site (Figure 5), which had the lowest proportion of introduced plant species (30%). The FQAI score ranged from a high of 22.8 in this northeastern corner to a low of 6.3 in the Phragmites-dominated interior and areas adjacent to the DeGraw Avenue southern boundary of the property. Diversity (as measured by the Simpson Diversity Index) was found to be significantly lower (F26,1 = 63.84, p = 0.098) in the Phragmites-dominated D3 sampling unit than in the high FQAI G2 and H2 areas (Figure 6).
Discussion
Although surrounded by highly urbanized land use, the forested wetlands of the Conservancy contained 245 different plant species. Significant differences were found in the distribution of native versus introduced plant species, and in habitat conservation values across the site. The overall number of native species was 60% of the total species on site, a proportion quite similar to that observed by Clemants and Moore (2003) in their survey of native and nonnative flora in large northern urban areas. We note that at the Conservancy site, the proportion of introduced species is four times greater than that reported by Ehrenfeld (2005) in northern New Jersey forested wetlands. However, because the two studies used different sampling methods, it is possible that differences in the proportion of nonnative species are the result of sampling methodologies.
Habitat values as described by the FQAI score appear to be more strongly influenced by hydrology than the various soil substrates. The importance of hydrology in determining wetland vegetation is well documented (Toner and Keddy 1997; Magee and Kentula 2005; Dwire et al. 2006), and in this study, 9 of the grids with the highest FQAI values were associated with wet or mixed moisture regimes versus 3 high FQAI-value grids characterized as dry. Conversely, 8 of the highest FQAI-value locations were composed of fill or mixed materials, while only 4 high FQAI-value locations had native soils. The two highest FQAI values were associated with wet and native soils (locations G2 and H2), and these areas must be protected from disturbance during and following restoration activities. However, it is obvious from our observations that these two variables alone will not guarantee high FQAI scores (see locations B5 and G1).
The results of this study will be used to delineate low FQAI-value areas where removal of fill and/or reintroduction of saturated hydrology could produce environmental conditions that would support replanting of native wetland flora (A2, A3, A4, C3, D4, F4). Conversely, areas that have been filled, yet exhibit high FQAI values, may be better left as they currently are (B3, B4, C1, C2). One question left to be decided is how to address relatively large wet areas with low FQAI value (see D3, D4, E3) that are currently functioning as a Phragmites-dominated detention basin for stormwater storage.
Future analyses will combine hydrology information related to the subwatersheds on site (Obropta et al. this volume) with data from the vegetation and soil surveys to determine native vegetation best able to survive in the reestablished wetland areas. A second vegetation study has now been set up that tests the ability of different facultative wetland plants to survive in field plots under the various combinations of wet versus dry, and native versus fill soils. The results of this study will help identify plant species likely to survive under environmental conditions that will be present in the Conservancy's rehabilitated wetlands. This study also shows the need for a comprehensive invasive control plan to be included as a component of the Conceptual Restoration Plan.
Acknowledgments
Funding for this work was provided by the New Jersey Wetlands Mitigation Council. We thank the staff of the Teaneck Creek Conservancy for their help and support with fieldwork. We also acknowledge Bill Olson for his help in identifying plant species.