PUBLISHED: IN PRESS

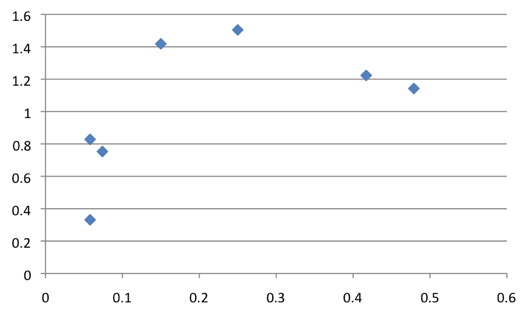
Figure 4. Scatterplot of average male density (x-axis) by annual productivity (y-axis) for the seven reserves having data for at least five males. The three large reserves are the three left-most points (FF, HL, OG, LR, SS, CD, DH, right to left). Similar patterns resulted with scatterplots of average density by reproductive success and average density by fledging success for these seven sites.