PUBLISHED: JULY 2011

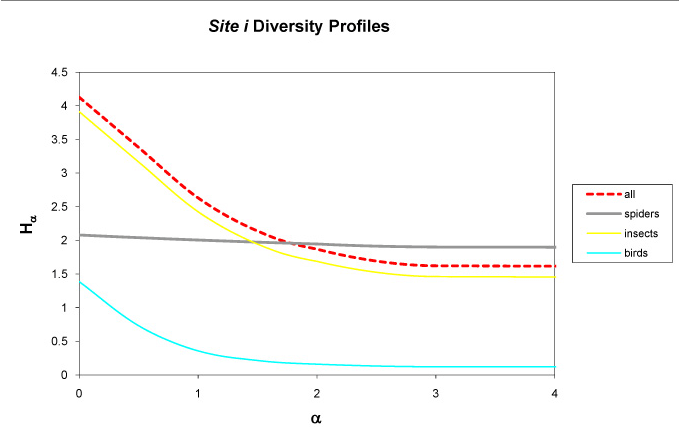
Figure 4: Curves represent diversity Hα (y-axis) of insects (yellow), spiders (gray), birds (blue), and all taxa combined (dashed red) for site i across scales of α (x-axis), with integer values of α corresponding to conventional metrics of diversity: 0 (richness), 1 (Shannon's), 2 (Simpson's), 3 (Berger-Parker) and 4 (infinity). The curves indicate a ranking of diversity of insects, spiders, and birds.