PUBLISHED: JULY 2011


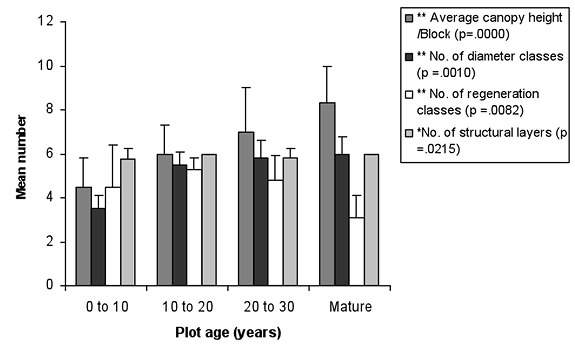
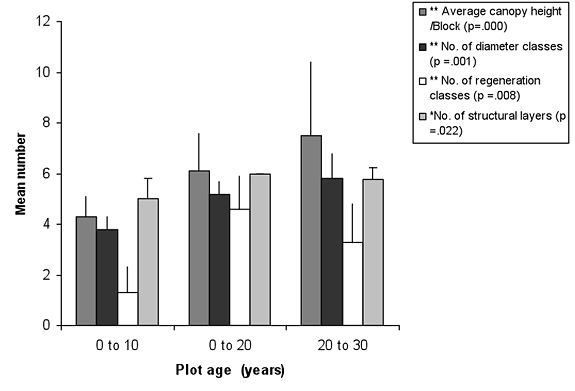
Figure 3. Forest structure variables in (a) control and (b) low-maintenance plots of different ages. Significant differences between age classes are indicated by * p < 0.05, and ** p < 0.01. Mean ± SD is shown for each measured variable.