PUBLISHED: MAY 2008

Increasing Interactions with Nature: A Survey of Expectations on a University Campus

Figure 7c

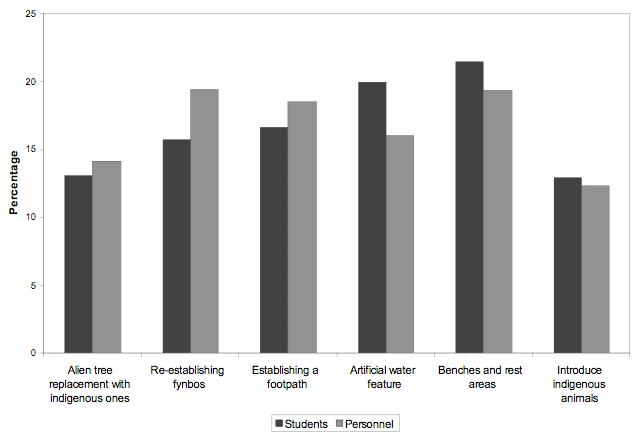
Figure 7c: The percentage of support students and personnel give to suggested improvements on campus. There are statistically significant differences between the options they support (Students: Χ<sup>2</sup> = 331.19, df = 5, p < 0.05; Personnel Χ<sup>2</sup> = 92.39, df = 5, p < 0.05) as well as significant difference between the options supported by students as opposed to the options supported by personnel (Χ<sup>2</sup> = 55.42, df = 3, p < 0.05).

Figure 7c: The percentage of support students and personnel give to suggested improvements on campus. There are statistically significant differences between the options they support (Students: Χ2 = 331.19, df = 5, p < 0.05; Personnel Χ2 = 92.39, df = 5, p < 0.05) as well as significant difference between the options supported by students as opposed to the options supported by personnel (Χ2 = 55.42, df = 3, p < 0.05).