PUBLISHED: MAY 2008

Increasing Interactions with Nature: A Survey of Expectations on a University Campus

Figure 4

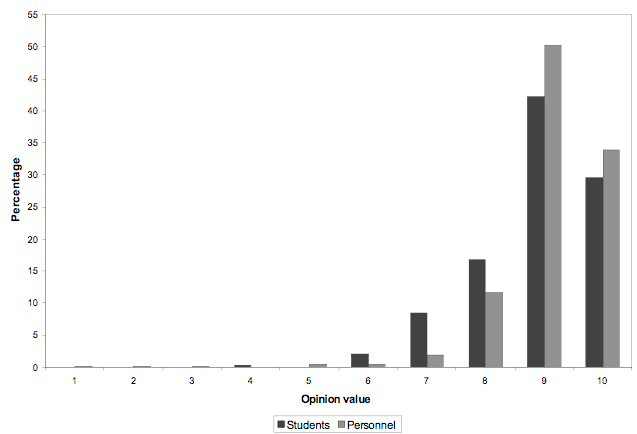
Figure 4: Graph representing, as a percentage,  the opinion value of respondents regarding nature. Both students and personnel show a significant positive that averages 9 (students: Χ<sup>2</sup> = 1118.55, df =9, p < 0.05), personnel: Χ<sup>2</sup> = 549, df = 9, p < 0.05). Personnel places a significantly higher value on nature than students (Χ<sup>2</sup> 20.75, df = 9, p < 0.05).

Figure 4: Graph representing, as a percentage, the opinion value of respondents regarding nature. Both students and personnel show a significant positive that averages 9 (students: Χ2 = 1118.55, df =9, p < 0.05), personnel: Χ2 = 549, df = 9, p < 0.05). Personnel places a significantly higher value on nature than students (Χ2 20.75, df = 9, p < 0.05).