PUBLISHED: DECEMBER 2005
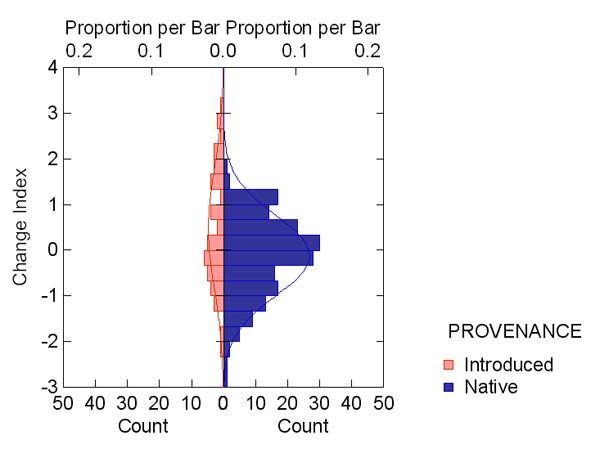
Figure 3. A dual histogram of the change indices for introduced (nonnative) and native species. These graphs show the distribution of change index values for the 226 species studied.